
Auckland's property market has its ups and downs: how is each area faring?
Auckland's property market has recently resembled a roller coaster, constantly lurching up and down. The rapid growth driven by the pandemic over recent years has given way to a decline caused by soaring interest rates. The media is full of alarming stories about negative equity, where a home's current value is lower than the outstanding mortgage, but the reality is less dramatic. Yes, prices are falling, but compared with the remarkable gains of the past 10 years, the current decline is at most a correction. House prices have not even fallen back to 2020 levels.
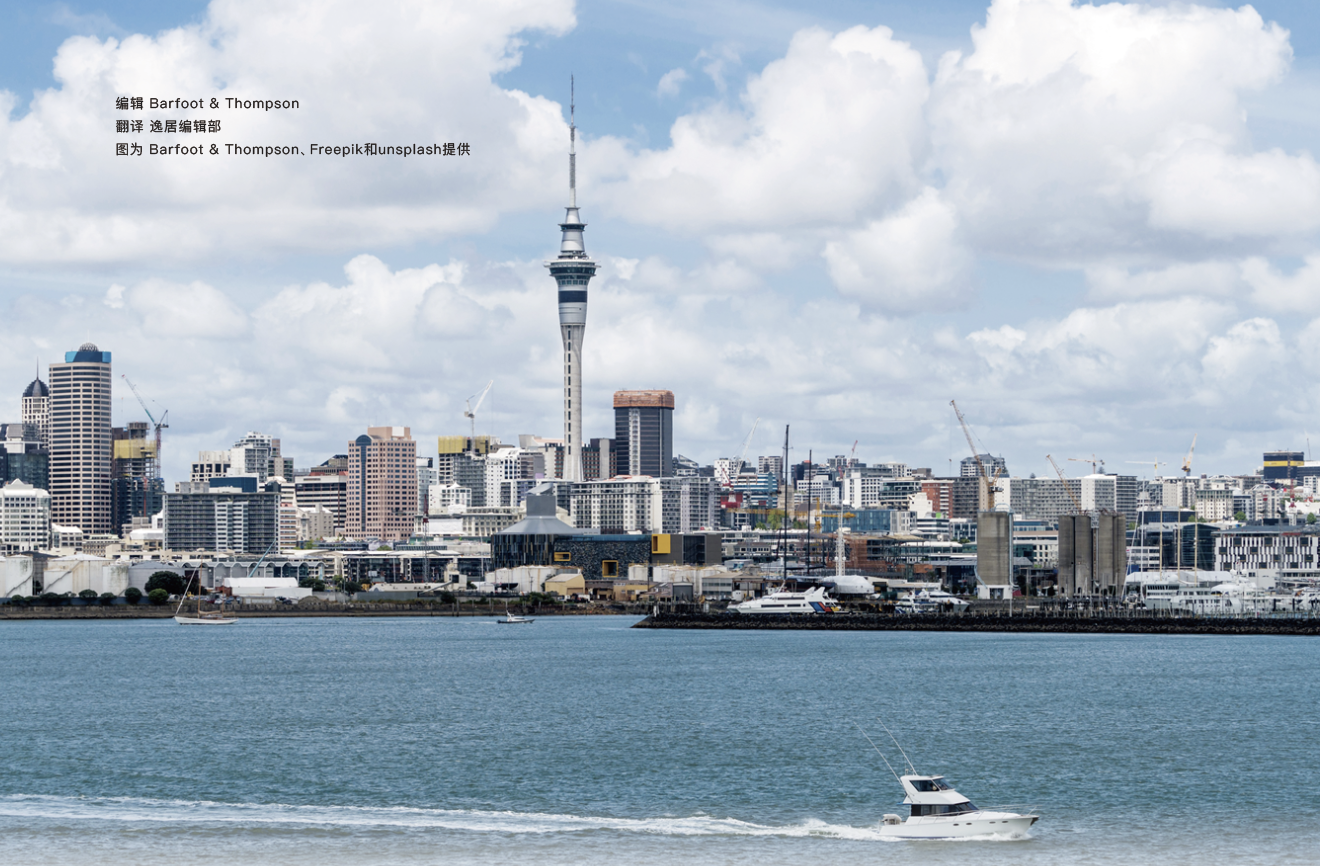
Auckland's property market has recently resembled a roller coaster, constantly lurching up and down. The rapid growth driven by the pandemic over recent years has given way to a decline caused by soaring interest rates. The media is full of alarming stories about negative equity, where a home's current value is lower than the outstanding mortgage, but the reality is less dramatic. Yes, prices are falling, but compared with the remarkable gains of the past 10 years, the current decline is at most a correction. House prices have not even fallen back to 2020 levels.
Nor is all of Auckland experiencing this correction. Our detailed analysis below shows that Auckland's market comprises many different segments, with a complex mix of trends across its areas. Whether you are a prospective buyer or seller, or simply curious about the market, take a look at what is happening in your neighbourhood or an area that interests you, and what your neighbours are actually thinking. You will see that some parts of Auckland have changed far more markedly than others: some have fallen further, some are striving to hold their value, and others keep rising.
Both sales volumes and prices are currently low in Auckland's property market, but this quiet spell is simply a hangover from the 2021 boom: sales in 2021 were about 30% higher than in 2022. Sales volumes from month 5 to October in 2022 were the lowest for the corresponding period in recent years, 15% below the next-lowest year, 2017. However, recent figures suggest sales are stabilising. Barfoot & Thompson's figures show that sales in October 2022 were 2.1% higher than in September 2022, and 3.8% above the average for the past 3 months. New listings in October increased by 5.4% compared with September, although they remained below previous levels for the same period.
Statistical methodology:
The charts below show data for the 6 months from May to October over the past 11 years. The highest- and lowest-priced 1% of sales have been removed, along with leasehold and car park sales, to prevent transactions at either extreme from distorting the data.
How the data is presented:
Sales are divided into 4 equal groups by price, each represented by a different symbol. The lowest 1/4 of sale prices is represented by the circle on the far left. Prices between the lower quartile and the median, in the lower-middle range, are represented by the small rectangle on the left. The next 1/4 of sale prices is represented by the small rectangle on the right. Together, these 2 small rectangles make up the middle 50% of the market, with the median price at their midpoint. The highest 1/4 of prices is represented by the small circle on the right.
The horizontal axis shows prices in millions of New Zealand dollars, and the vertical axis shows years. These charts illustrate the spread of sale prices, broken down by area, providing a clearer understanding of market conditions.
Across Auckland as a whole, the median from month 5 to October in 2022 was slightly below the corresponding period in 2021, but still above the same period in 2020. The median from month 5 to October in 2021 was NZ$1,150,000, up 18% on 2020. In 2022, it was NZ$1,111,000, a decline of just 4%.
The lowest 1/4 of house prices sits at NZ$860,000, indicating that homes below NZ$800,000 can still be bought in Auckland. In early November 2022, Barfoot & Thompson had more than 1000 homes for sale below NZ$800,000.
Areas with rising prices: Franklin, Manukau (+3%), Rodney (+4%)
Areas with falling prices: city centre (-13%), West Auckland (-8.6%), Central East (-11%), Central West (-3%), North Shore (-3%),
Stable areas: East Auckland (-1%), South Auckland (-2%), Pakuranga/Howick (-1%).
In our view, Auckland house prices are holding up remarkably well, especially given how quickly mortgage rates have risen and how pessimistic the economic outlook is. Yes, Auckland's median house price in October 2022 was 14% below November 2022, and yes, sales volumes have fallen by 3 tenths. But Auckland's property market is far from the free fall some people claim. The median house price in October 2022 was only 5% below October 2021, and the figures across the full 6 months from month 5 to October tell the same story.
Part of the reason is that Auckland is made up of many individual markets. If you are buying or selling in the south, west or north, simply comparing the overall median with its peak tells you little.
What really matters to buyers and sellers is sale prices and activity in their particular area, generally within 10–15 kilometres of where they live. We have therefore divided Auckland into 10 areas to help buyers and sellers understand the market more clearly.
Take Auckland's city centre and the surrounding inner suburbs as an example. The large number of apartments sold in the city centre means its median price is considerably lower than that of the surrounding inner suburbs, where many sales are of standalone houses. The resulting price distortion is much greater than in any other New Zealand city.
The detail in this article's data gives a good indication of the extent of real-world house price changes, but it remains an overview. We still recommend that buyers and sellers contact an agent with strong local roots. Even within the same area, some homes follow different price trends from others. Local agents know every street and can provide enough information to explain why.
In my personal view, the market has now corrected from its record high in 2021 and reached a plateau. Investor interest is limited, owners have no intention of selling below a reasonable price, and first-home buyers are proceeding very cautiously.
The pandemic brought ultra-low interest rates, creating exceptional trading conditions throughout 2021. Some subsequent correction was entirely expected, and its effect on the market has begun to diminish as summer approaches. If the market follows its usual pattern, sales volumes will decline in January and February after the holidays. We will have to wait until March to know whether current conditions are a temporary lull or actually signal the bottom of a downturn.
Peter Thompson,
Managing Director, Barfoot & Thompson
With its large number of apartments, Auckland's city centre sits at the bottom of the region's sale price range and has experienced a greater price correction than other areas. Compared with 1 year earlier, its median price fell from NZ$772,000 to NZ$685,000, a decline of 12.5%.
City centre apartment rents eased during this period as the continuing effects of the pandemic sharply reduced demand from international students and tourists, while the number of apartments available for short-term rental increased substantially. However, falling city centre rents have not affected rents elsewhere in the area, and rents are now stabilising.
Areas covered: City centre, Eden Terrace, Grafton, Wynyard Quarter.
“Auckland's city centre market is very different from other areas because it has so many apartments. Some need repairs or are undergoing repairs, prompting buyers to factor these future costs into lower offers. Leasehold properties also have an influence. As in other cities, the pandemic affected international education and tourism, weakening apartment demand and pushing down both rents and sale prices. Auckland has two major universities, making the impact greater, while some owners have also chosen to exit because of factors such as high repair costs.”
“With improving yields, the return of international students and tourists, and the construction of new apartments, the city centre market is recovering. The number of apartments available to rent is now starting to fall below previous levels for this time of year, and we may see prices begin to adjust over the coming months.”
Sandra Forrester
Barfoot & Thompson City Branch Mananger
Prices are still rising in some outlying areas. In Franklin and Manukau, prices in 2022 were 3% higher than in 2021, with the median rising from NZ$907,000 to NZ$932,500.
These areas often benefit from new developments, such as Paerate Rise, linking Karaka to Pukukohe. These large developments bring new infrastructure and transport facilities, including roads and public transport. Meanwhile, the growing popularity of new working arrangements, such as working from home, allows people who previously had to live near the city centre to choose these areas.
Areas covered: Awhitu, Bombay, Buckland, Clarks Beach, Glenbrook, Glenbrook Beach, Hunua, Kingseat, Mangatangi, Mangatawhiri, Manukau Heads, Mercer, Onewhero, Patumahoe, Pokeno, Pollok, Port Waikato, Pukekawa, Pukekohe, Pukekohe East, Ramarama, Tuakau, Waiau Pa, Waiuku.
“For many people, Franklin/Manukau is the furthest area from the city, yet it has proved to be a rapidly developing hotspot, offering a broad range of housing, fast-growing communities and many opportunities for economic growth. From modest older homes costing upwards of NZ$500,000 to new townhouses above NZ$900,000, and even lifestyle properties worth millions of New Zealand dollars, there are options to suit different budgets. New developments are a key driver of the area's growth, bringing many new facilities, such as early childhood centres and primary and secondary schools. Commercial projects in surrounding areas such as Drury, Karaka are also creating more opportunities for economic development and employment. Public transport continues to expand and improve, with new bus routes connecting to Pukekohe town centre and 3 light rail stations due to be completed.”
Nick Bates
Barfoot & Thompson Pukekohe Branch Mananger
South Auckland's prices have held up better than those in other areas. The median price edged down by NZ$15,000, just 1.65%, and its middle price range is also somewhat narrower than elsewhere. Traditionally a lower-priced area, South Auckland's prices are influenced by some new developments aimed at first-home buyers, but are more predictable. From 2016 to 2019, the median price rose by just NZ$11,000, from NZ$676,000 to NZ$687,000.
Although South Auckland's property market is dominated by lower-priced homes, it still has some higher-priced properties scattered throughout, as every other area does. Properties in the upper quartile sell across a wide range, from NZ$1,100,000 to NZ$3,000,000.
Areas covered: Alfriston, Ararimu, Ardmore, Clendon Park, Clover Park, Conifer Grove, Drury, East Tamaki, Mangere Bridge, Mangera East, Manukau, Manukau Central, Manurewa, Manurewa East, Opaheke, Otahuhu, Otara, Pahurehure, Papakura, Papatoetoe, Puni, Randiwick Park, Red Hill, Rosehill, Takanini, The Gardens, Totara Heights, Wattles Downs, Weymouth, Wiri.
West Auckland's median has fallen noticeably over the past year. It was NZ$1,104,000 in 2021 and NZ$1,050,000 in 2022, a decline of NZ$54,000. However, compared with the increase from 2020 to 2021, when prices rose by more than NZ$260,000, from NZ$878,900 to NZ$1,140,000, this decline is negligible. It could also be seen as a return to balance after a period of selling.
The last decline in West Auckland's median was in 2017, when it fell by NZ$40,000, followed by two years of stagnation. The median was NZ$80.5 in 2016, NZ$740,000 in 2017, and NZ$780,000 in 2019, before rising sharply to NZ$878,900 in 2020.
Areas covered: Avondale, Blockhouse Bay, Glen Heights, Glendene, Green Bay, Henderson, Henderson Heights, Herald Island, Hobsonville, Karekare, Kelston, Laingholm, Massey, Massey West, New Lynn, Oratia, Piha, Ranui, Royal Heights, Sunnyvale, Swanson, Te Atatu Peninsula, Te Atatu South, Titirangi, Waiatarua, Waitakere, West Harbour, Westgate, Whenuapai.
Auckland's Central East median price fell by almost NZ$135,000 (-11%). However, the 2021 median of NZ$1,365,000 was NZ$170,000 above the 2020 median of NZ$1,194,000. This shows that despite the substantial correction over the past year, the median has still not fallen below its 2020 level. Comparing the medians for 2020 and 2022 shows an increase of 3%. Central East was also the only area to record four consecutive annual declines between 2016 and 2019, with its median remaining unchanged for much of the rest of the time.
Areas covered: Epsom, Greenlane, Hillsborough, Lynfields, Mt Eden, Mt Roskill, New Windsor, One Tree Hill, Onehunga, Penrose, Royal Oak, Sandringham, Three Kings.
“Although overall sale prices have eased, this has not erased the gains of recent years, and prices in the area are similar to 2020 levels. Some of this year's changes represent an adjustment from the 2021 peak, as well as a response to reduced affordability caused by recent interest rate rises and greater difficulty obtaining loans. We are now seeing some signs of stability, with strong open home attendance and sales volumes beginning to stabilise. Properties priced in the high NZ$1,000,000 range to the low NZ$2,000,000 range, along with those offering development potential, are attracting particular attention.”
David Kelly
Barfoot & Thompson Epsom Branch Manager
East Auckland's median price has barely changed, with a difference of just 1% between 2022 and 2021. The area recorded substantial growth between 2012 and 2016, rising from NZ$685,000 in 2012 to NZ$1,198,000 in 2016, an increase of 42% over 5 years. Prices then eased between 2016 and 2019, falling by a total of 8% over four years.
From month 5 to October in 2022, the middle price range spanned NZ$900,000, slightly narrower than the NZ$1,000,000 span in the same period of 2021. East Auckland offers a diverse and widely distributed range of properties. Sales above NZ$2,000,000 are currently quiet, with market activity concentrated in the NZ$1,000,000–2,000,000 range. Sale prices are therefore likely to become concentrated within a narrower band.
Areas covered: Ellerslie, Glen Innes, Glendowie, Kohimarama, Meadowbank, Mission Bay, Mt Wellington, New Market, Orakei, Panmure, Parnell, Pt England, Remuera, St Heliers, St Johns, Stonefields, Wai O Taiki Bay.
Like Franklin/Manukau, Rodney recorded a modest increase from month 5 to October in 2022 compared with the same period in 2021. Prices rose by 4%, from NZ$1,190,000 to NZ$1,237,000. Although Franklin/Manukau and Rodney are geographically distant from central Auckland, they share characteristics that may explain why their trends run counter to the rest of Auckland.
These areas on the city's fringe have historically been large rural greenfield areas untouched by residential intensification. They are close enough to enjoy the city's conveniences, yet far enough away to offer space, the desired lifestyle and affordability. Auckland baby boomers retiring to these areas, alongside more people being able to work from home, have supported further growth. As a result, prices have not faced the same pressures as in other parts of Auckland.
Areas covered: Ahuroa, Algies Bay, Arkle Bay, Army Bay, Dairy Flat, Glorit, Gulf Harbour, Hatfields Beach, Helensville, Huapai, Kaukapakapa, Kumeu, Little Manly, Manly, Matakatia Bay, Muriwai, Orewa, Puhoi, Red Beach, Riverhead, Silverdale, Stanmore Bay, Stillwater, Taupaki, Tindalls Beach, Wade Heads, Waimauku, Waitoki, Wark worth, Wellsford, Whangaparaoa.
Auckland's Central West median also fell slightly, down 3% from NZ$1,592,000 to NZ$1,545,000. Over the years, the area has shown a pattern of variability unlike many others. In years when growth elsewhere stalled, it recorded both rises and falls: an increase from 2016 to 2017, a sharp decline from 2017 to 2018, and another rise from 2018 to 2020. There is something for everyone here, from lavish large luxury homes to smaller standalone houses, townhouses, units and apartments. The range of housing is extensive. The city centre remains easy to reach, with public transport connections in almost every direction, as well as quick access to the North Shore and the Waterview Tunnel heading south towards the airport.
Areas covered: Freemans Bay, Grey Lynn, Herne Bay, Kingsland, Morningside, Mt Albert, Ponsonby, Pt Chevalier St Lukes, St Marys Bay, Waterview, Western Spring, Westmere.
“Central West has a broad spread of prices and property types, which is important to consider when examining the data and observing changes. For example, median prices in Herne Bay, Freemans Bay and St Marys Bay often exceed NZ$2,000,000. This contrasts sharply with lower-priced areas a little further away, such as St Luke's and Waterview, and the growing number of apartments and terraced houses in other areas.”
“Across Ponsonby and its surrounding areas, we are seeing strong interest in homes worth millions of New Zealand dollars in Freemans Bay and Herne Bay, but very few current listings meet this demand. The lower median and fewer sales above NZ$2,000,000 may owe more to a reduction in listings in this part of the market than simply to falling sale prices. Vendors who price their properties in line with the market generally achieve a sale quickly.”
Chris Batchelor
Barfoot & Thompson Ponsonby Branch Manager
On Auckland's North Shore, prices from month 5 to October in 2022 fell by 6% compared with the same period in 2021, with the median declining from NZ$1,350,000 to NZ$1,280,000. This followed gains of 19% in 2021 and 10.09% from 2019 to 2020. The current median remains NZ$192,500 above the corresponding period in 2020.
Areas covered: Albany, Albany Heights, Bayview, Beach Haven, Belmont, Birkdale, Birkenhead, Browns Bay, Campbells Bay, Castor Bay, Chatswood, Coatesville, Devonport, Forrest Hill, Glenfield, Greenhithe, Hauraki, Hillcrest, Long Bay, Mairangi Bay, Milford, Murrays Bay, Narrow Neck, Northcote, Northcross, Okura, Oteha, Paremoremo, Pinehill, Rothesay Bay, Sunnynook, Takapuna, Torbay, Unsworth Heights, Waiake, Windsor Park.
Of all the areas, Pakuranga/Howick has the highest price range for the lowest 1/4 of sales, meaning the entry threshold is high, although its median remains below Central West Auckland's. The current median is NZ$1,384,000, down just 1.2% on last year.
Areas covered: Beachlands, Botany Downs, Bucklands Beach, Burswood, Cockle Bay, Dannemora, East Tamaki Heights, Eastern Beach, Farm Cove, Flat Bush, Golflands, Half Moon Bay, Highland Park, Howick, Huntington Park, Maraetai, Mellons Bay, Northpark, Pakuranga, Pakuranga Heights, Shelly Park, Somerville, Sunny Hills, Whitford.