
Rising or falling? Which of these conflicting house price reports should you believe? Do you understand the house price ‘iceberg effect’?
Just last week, 2 reports with completely opposing conclusions were released almost simultaneously, leaving the market unsure which way to turn.

Just last week, 2 reports with completely opposing conclusions were released almost simultaneously, leaving the market unsure which way to turn.
These 2 reports both came from relatively authoritative organisations: Auckland’s largest real estate agency, Barfoot & Thompson, and CoreLogic, a data provider with a long history of supplying a wide range of statistics.
Rising and falling: completely opposing findings
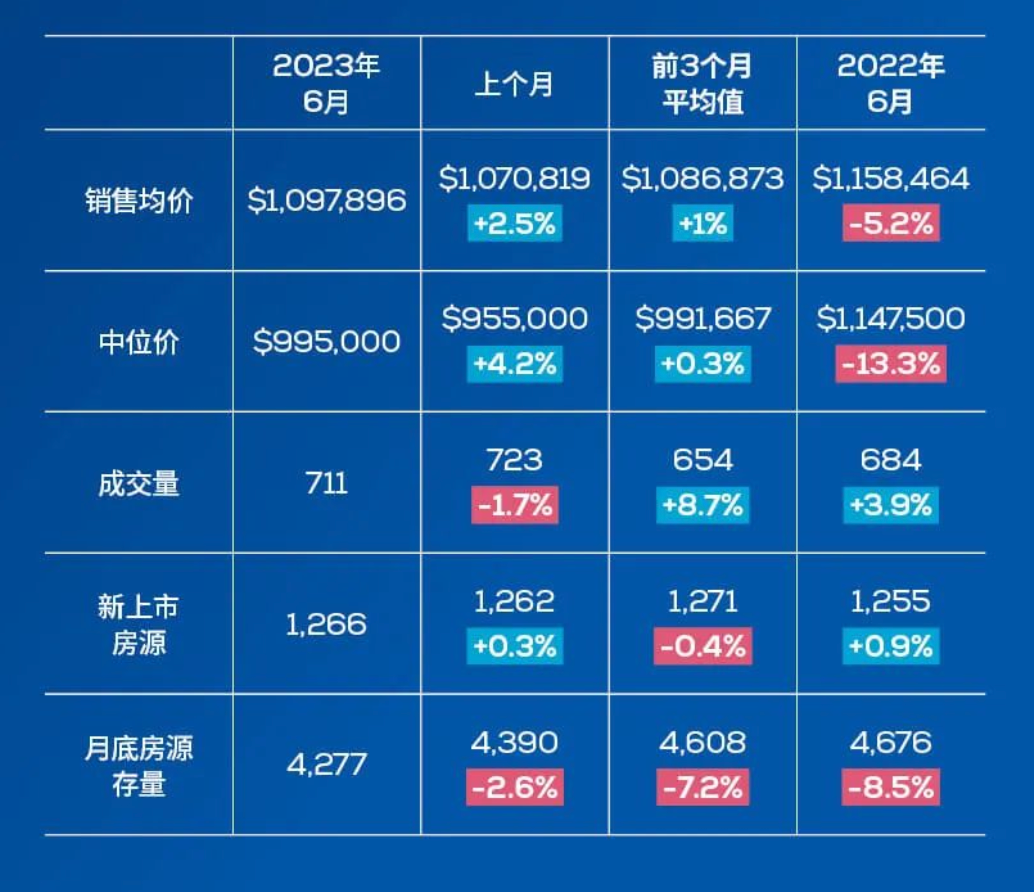
Barfoot & Thompson’s report described Auckland house prices in June as follows:
“Sales in June totalled 711 properties, bringing the market back to volumes comparable with the same month before the pandemic, and 3.9% above June 2022. Sales continued to recover after reaching a record low in April.
“The average sale price in June was NZ$1,098,000, up 2.5% from May and 1% above the average for the preceding three months. The median price was NZ$995,000, up 4.2% from May.
“Once we exclude the recent rises and falls in house prices, the only meaningful comparison with current prices is 2019, when we were in a genuinely market-driven cycle. Both the average and median sale prices achieved in June were around 17% higher than in the same month four years earlier.
“More properties attracted multiple offers, and auction rooms were busy throughout the month. Although this increase in activity has not pushed prices higher, it indicates that confidence is returning, which is good news for sellers and buyers alike.”
CoreLogic, however, provided a completely different set of figures, presenting almost the opposite picture:
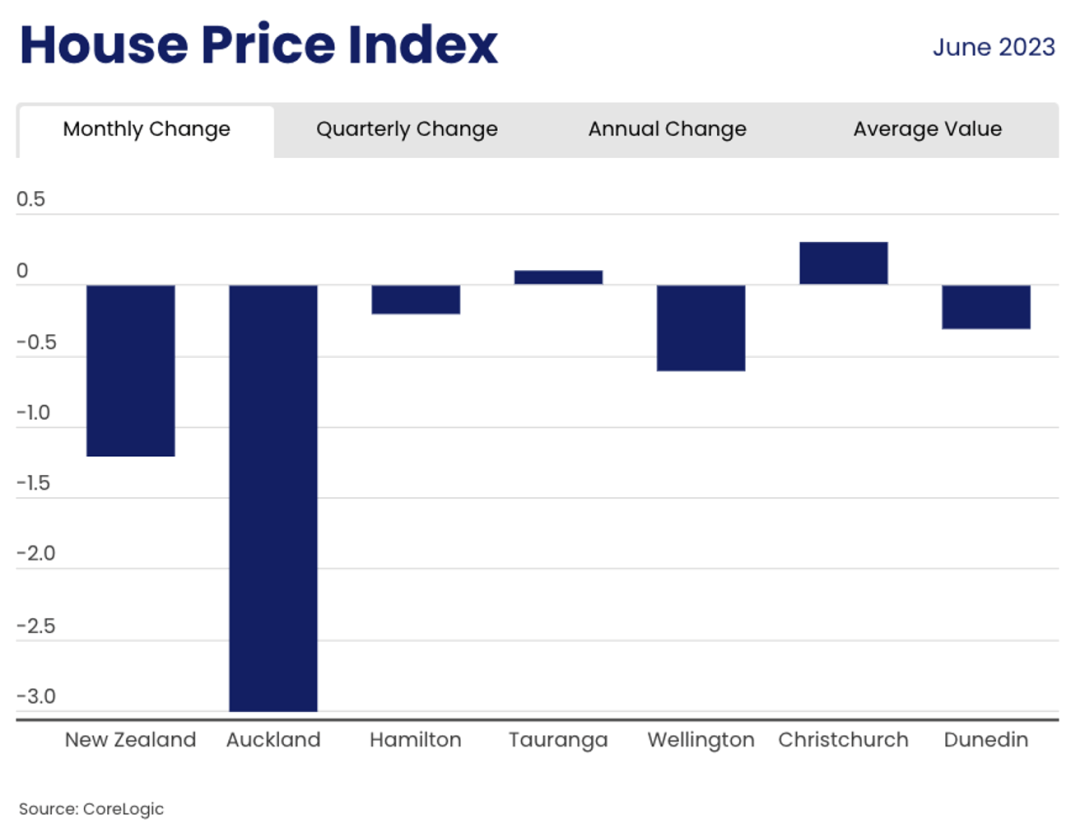
“CoreLogic data shows that house prices fell in June at almost twice the rate of the previous month.
“The property data company’s House Price Index (HPI) shows that June marked the third consecutive month of falling prices. The average decline was 0.7% in May and 0.6% in April, while in June it reached 1.2%.
“CoreLogic’s HPI shows that the Auckland region recorded the steepest fall in house prices, down 3% over the month.
“Auckland was among the leaders in house price growth, with prices in its central suburbs falling 5.1% this month, while prices in Franklin fell 6.1%.”
What is the truth?
Although the reports reached opposing conclusions, neither was lying. In fact, the substantial differences in their statistical methods, together with the house price ‘iceberg effect’, produced these results.
CoreLogic’s HPI is calculated using changes in property sale prices relative to their rating valuations (RVs) after settlement, through the SPAR method. Barfoot & Thompson, meanwhile, bases its figures on unconditional sales agreements from the most recent month.
In statistical and trend terms, CoreLogic’s figures have a greater lag because settlement generally takes around 1–3 months, with an uneven distribution. Its movements are smoother and ‘slower’, producing more of a delayed curve with intervening fluctuations filtered out. Barfoot & Thompson’s data is more frequent and shows more fluctuations.
{ad}
The house price iceberg effect
A defining feature of housing market prices is their stickiness, known in the industry as the ‘iceberg effect’.
Suppose a new neighbourhood has 10 similar properties for sale, with comparable sizes and prices. Of these 10 properties, 6 are offered at $1,000,000 and 4 at $950,000, but the market price shows only $950,000.
After a while, however, 4 of the 10 properties have sold, and 4 more have been added at $1,050,000. The market now has 4 offered at $1,050,000 and buyers for 6 at $1,000,000. Yet the market price still shows $950,000, giving no indication of the change in market conditions.
After another period, the market actually has 9 properties offered at $1,050,000 and 1 at $1,000,000. Only when a property sells for $1,000,000 does the market price become $1,000,000, making it appear that prices have risen 5% overnight. Another sale can quickly take the price to $1,050,000, prompting media exclamations about a 10% rise in just a few days.
This is like an iceberg at sea: only its tip is visible, and its enormous size becomes clear only when you collide with it. That is why this pricing phenomenon is called the ‘iceberg effect’.
If this happens within a neighbourhood, the iceberg effect across an entire city will be even more pronounced. This is why frequent leading data matters: the more frequent the data, the less price stickiness or iceberg effect there is. Of the 2 reports covering the same period, Barfoot & Thompson’s figures will show less of an iceberg effect than CoreLogic’s HPI data.
The decisive role of sales volumes and leading indicators
Real estate is immovable property, and the name itself points to its lack of liquidity: what we often describe as ‘a price but no buyers’. Another saying goes, ‘There is nothing that cannot be sold, only a price at which it cannot be sold.’ In other words, an apparent lack of liquidity simply means the price is not low enough.
Sales volume is precious in real estate: it is what we commonly call liquidity. Liquidity means properties can sell at market prices without further reductions. Put another way, buyers have actually raised the prices they expect to pay.
Changes in sales volumes reveal the following:
“Sales in June totalled 711 properties, bringing the market back to volumes comparable with the same month before the pandemic (2019), and 3.9% above June 2022. Sales continued to recover after reaching a record low in April.”
Even CoreLogic acknowledges that sales volumes have begun to rise:
“…Combined with rising property sales, this means the total stock of properties on the market is declining. Reduced supply, together with high net migration, improving confidence, looser credit requirements under the CCCFA and LVR rules, and mortgage rates nearing their peak, is supporting demand and creating the conditions for an impending shift in the market.”
Another leading indicator is Auckland’s residential auction clearance rate. From February 2023, clearance rates began recovering after bottoming out at 20% in November 2022, reaching almost 50% by May. This clearance rate has already exceeded levels seen during the balanced market of 2016–2019 and is beginning to approach those of the second half of 2019.
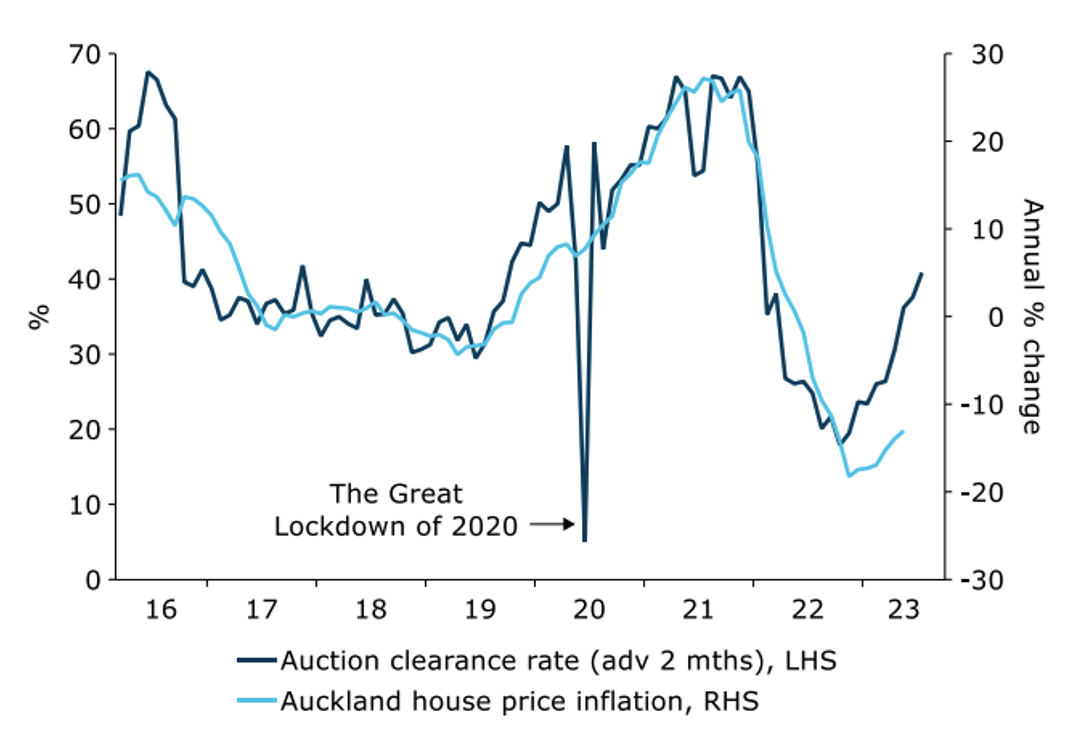
As a leading indicator, this suggests that many properties have changed hands and those offering ‘value for money’ have already been bought. The next step is for properties offering less ‘value for money’ to begin selling, bringing modest price increases. The iceberg effect is pronounced during this process.
“Undervalued” Auckland
New Zealand’s population growth currently relies mainly on immigration, while many local Kiwis are leaving for Australia. Auckland is immigrants’ preferred city, whereas departing Kiwis come from across the country, so Auckland is receiving the bulk of the population inflow.
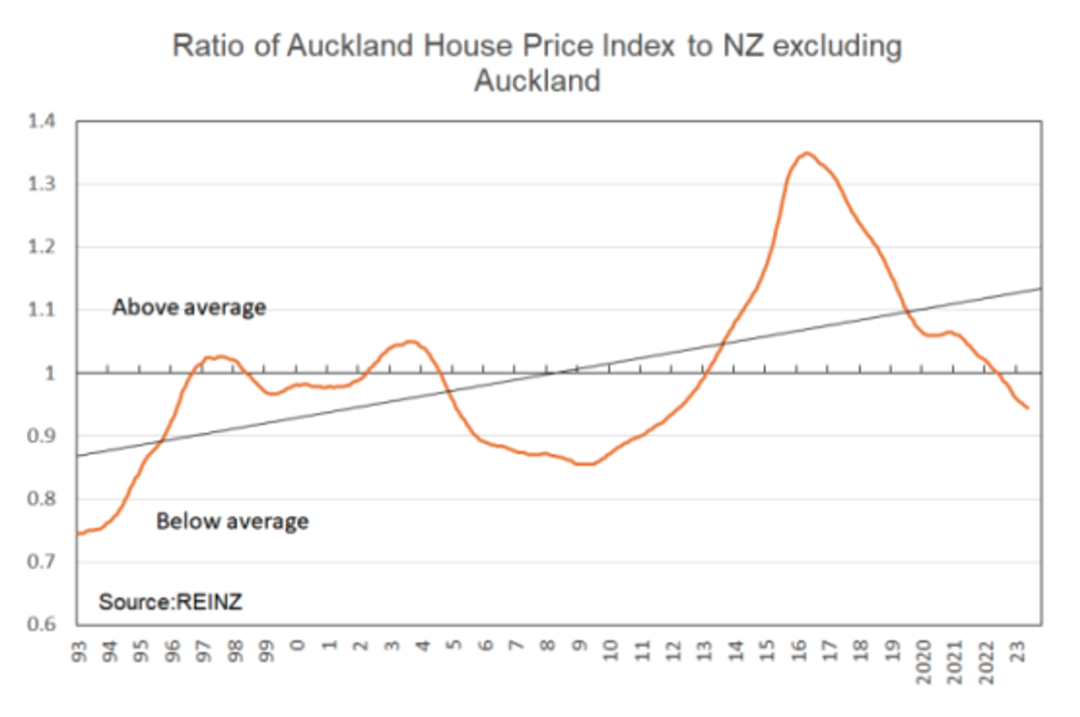
Yet Auckland house prices currently show a negative deviation from national house prices, as indicated by the orange line in the chart below. Relative to the long-term trend line, shown in black, they have also reached the lower end of their historical range of fluctuations (see below). Auckland property therefore currently offers the most attractive entry point relative to New Zealand as a whole.
See through the ‘iceberg’ and engage directly with the market
Disagreement about the market is normal and is precisely what characterises trading at the bottom. Markets typically bottom out amid disagreement before gradually beginning to rise.
At the same time, disagreement means buyers still have opportunities to find suitable homes. There can be considerable differences between individual areas, which buyers will struggle to identify from reports because of the iceberg effect.
What is needed is direct engagement with the market. Now is the time to take its pulse first-hand. Speaking with people who have extensive data and know the local market is essential to obtaining a true picture of conditions.