
South Island leads across the board! The housing market’s first-half 2026 report is out. Why does Auckland keep falling behind?
With the first half of 2026 behind us, New Zealand’s property market has delivered a revealing mid-year report card.
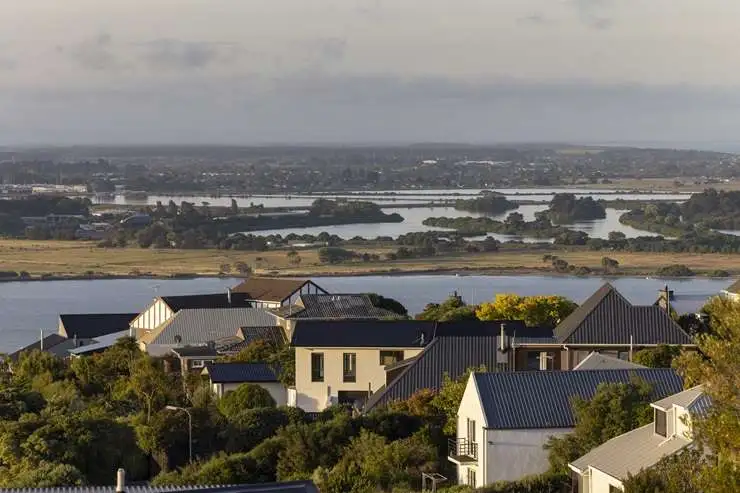
With the first half of 2026 behind us, New Zealand’s property market has delivered a revealing mid-year report card.
The latest OneRoof-Valocity House Value Index, released by OneRoof, shows New Zealand’s housing market experiencing its sharpest regional divergence in years: house prices across the South Island continue to strengthen, with several areas reaching record highs, while the North Island, particularly Auckland, remains in a correction.
This shift has also prompted a question worth watching: is capital gradually leaving Auckland for the South Island, where growth potential is greater?
Although the available data is not yet sufficient to prove a large-scale withdrawal of capital from Auckland, house price performance suggests the centre of gravity in New Zealand’s housing market may be quietly shifting.
South Island emerges as the biggest first-half winner
The data shows the South Island was the standout performer in the first half of 2026.
Of the 277 South Island neighbourhoods surveyed that recorded more than 20 sales over the past year, 240 (around 87%) saw house prices rise from the start of the year. Only 32 recorded declines, a substantially stronger overall performance than the North Island.
Among the results:
-
Southland’s average house price rose 5% to a record NZ$602,000;
-
The West Coast rose 4.5%, with its average house price exceeding NZ$500,000 for the first time;
-
Otago rose 3.3%, taking its average house price to NZ$1,050,000;
-
Canterbury’s increase was just 0.6%, but house prices there also set a new record.
Among the main centres, Dunedin was the best-performing major city in the first half of this year, with an increase of 4.2%. Invercargill maintained steady growth, rising 3.6%, while Queenstown-Lakes rebounded noticeably in the second quarter, with its average house price climbing back above NZ$2,178,000.
Homeowners in many neighbourhoods gained tens of thousands of dollars in paper wealth over the six months, with some gains approaching NZ$100,000. For example, Arrowtown’s average house price rose by around NZ$94,000, Mount Pisa’s by around NZ$87,000, and Te Anau’s by around NZ$86,000.
Why is the South Island outperforming the country?
The South Island’s latest rise is no coincidence; it reflects several factors working together.
First, the agricultural economy continues to perform strongly. Sustained high milk prices have boosted incomes in farming regions such as Southland, injecting more money into local economies and supporting housing demand.
Second, house prices in many South Island cities remain relatively affordable compared with Auckland. Cities such as Dunedin and Invercargill offer a lower entry point and remain attractive to first-home buyers and investors while borrowing costs are still relatively high.
Meanwhile, Queenstown-Lakes continues to benefit from the tourism recovery, an inflow of high-net-worth residents and limited land supply, with long-term demand remaining firm.
Taken together, its industry base, population movements and relatively healthy supply-demand balance have given the South Island housing market greater resilience than most parts of the country.
Why does Auckland keep falling behind?
Compared with the South Island, Auckland’s performance in the first half of this year was considerably weaker. Data shows that by the end of June, Auckland’s average house price was down 1.1% from the start of the year and 2.5% from a year earlier.
More significantly, among neighbourhoods whose sales volumes met the statistical threshold, nearly two-thirds of Auckland neighbourhoods recorded price declines from the start of the year.
Areas with larger declines included Waterview, Onehunga and Point Chevalier. These areas have seen substantial additions of townhouses and apartment developments in recent years, with increased supply putting some pressure on prices.
Mortgage rates remain relatively high, restricting many households’ buying budgets. Combined with the continued rise in living costs and a labour market that has yet to improve noticeably, this has led many potential buyers to keep waiting rather than rush into the market.
Meanwhile, more than 15,000 homes are listed for sale, giving buyers ample choice and significantly greater bargaining power, while further extending the time taken to complete sales.
By comparison, housing stock is relatively limited in many South Island areas, creating a more balanced relationship between supply and demand and noticeably more resilient house prices.
The North Island remains in a correction overall
In fact, the pressure extends beyond Auckland.
Data shows Hamilton’s average house price fell 0.7% in the first half of this year, while Tauranga’s declined 0.4%. Although Wellington’s six-month decline was less than 1%, its average house price remains around 30% below the peak reached in early 2022.
OneRoof’s figures show that of the 630 North Island neighbourhoods meeting the statistical criteria, 331 recorded house price declines in the first half of this year. Over the past year, 415 recorded declines.
Meanwhile, only 8 North Island neighbourhoods have reached record house prices this year, indicating that the overall market is still recovering.
Has the housing market really changed direction?
Auckland has long been regarded as the bellwether of New Zealand’s property market, with the national market often rising and falling in line with its performance.
Yet the data for the first half of 2026 paints a different picture: several South Island areas are repeatedly setting house price records, while Auckland and some North Island cities remain under pressure.
Does this mean capital has already begun leaving Auckland?
It is too early to draw that conclusion. House price trends are only one aspect of market performance and do not directly prove a large-scale shift in investment capital. However, regional performance does suggest that buyers’ and investors’ focus is changing.
Previously, many people focused more on the overall direction of the national housing market. Now, regional differences are becoming increasingly pronounced. An area’s industry base, population growth, employment opportunities, housing supply and economic vitality are having a deeper influence on local house prices than before.
For those preparing to buy a home or invest, the market’s first-half performance sends a signal worth watching: future house price trends may depend not just on interest rates and policy, but even more on each area’s own fundamentals.
Rather than focusing on when you can buy a home, it may be better to first give serious thought to a more important question: “Where should I buy?”