
House prices are still falling, yet more new homes are coming to Auckland? Diverging markets and building opportunities as the bubble deflates
House prices continue to fall, but signs of recovery are emerging in construction.
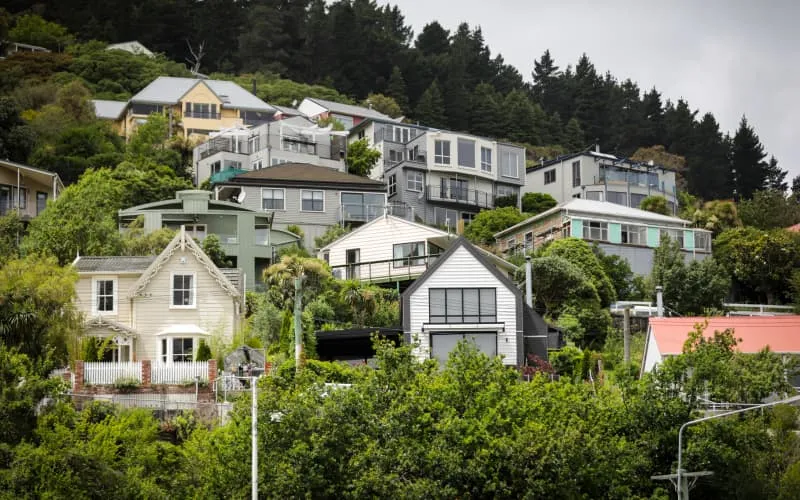
House prices continue to fall, but signs of recovery are emerging in construction.
As 2026 enters its final two months, New Zealand’s housing market presents a complex picture: Auckland and Wellington are still adjusting, while residential property valuations in parts of the South Island have reached new highs. Meanwhile, Auckland’s new-home completion indicators are beginning to recover, suggesting supply could gradually increase over the next two years.
ANZ senior economist Matthew Galt says the housing bubble that formed during the pandemic has largely deflated, but house prices could remain flat or edge lower for some time.
How can these changes happen at the same time? And what does the current market mean for homebuyers, developers and construction firms?
National average house values fall as regional markets head in different directions
According to the OneRoof–Valocity House Value Index released by OneRoof on 1 November, the national average property value fell 0.4% over the past three months to NZ$953,000. That is around NZ$145,000 below its February 2022 peak, a cumulative decline of 13.2%.
Auckland’s adjustment continues. The average property value across the city’s districts fell NZ$12,000, or 1%, over the past three months to NZ$1,232,000. It fell NZ$31,000 over the past year and is NZ$347,000 below its January 2022 peak.
However, the national average does not capture the picture in every region.
Otago’s average property value rose 1.7% over the same period to a record NZ$1,073,000. Within the region, Queenstown Lakes reached NZ$2,217,000, while Dunedin recorded annual growth of 5.3%, with an average property value of NZ$700,000.
Christchurch also performed relatively steadily, with its average property value reaching NZ$824,000, up 2.4% year on year and just NZ$3000 below its record high.
By contrast, the average property value in the Wellington metropolitan area is NZ$907,000, down 32.3% from its peak and now slightly below its pre-pandemic level.
This means it is becoming increasingly difficult to give a single national answer to the question of whether New Zealand house prices have bottomed out. Differences in employment, purchasing power, supply and demand are shaping each city’s market cycle.
The figures above are residential valuation indicators, rather than the average sale price of homes sold that month. They also cannot be used directly to determine the market sale price of an individual home.
If the bubble has largely deflated, why could house prices still fall?
According to an RNZ report on 21 October, ANZ assesses how far house prices are from long-term fundamentals using measures including price-to-income ratios, homeownership costs and construction costs.
The house-price-to-income ratio has fallen from nearly nine times in 2021 to around six times. This reflects both falling house prices and rising nominal incomes.
But more reasonable prices than at the peak do not mean prices are low enough to drive another upswing.
Matthew Galt says the ongoing costs of owning a home remain high relative to renting, and this may not change significantly over the next few years. That reduces the financial appeal of buying and keeps pressure on prices.
Long-term interest rates are another key influence on the market. If they are higher than expected, the prices buyers can afford could fall further; if they are lower than expected, current prices could become more sustainable.
The bubble having largely deflated therefore does not confirm that the market has bottomed out. ANZ’s analysis is closer to this: the extreme valuations of the pandemic period have been substantially corrected, but the remaining adjustment could still involve modest price falls, gradual income growth and a longer period of flat prices.
Auckland supply is recovering: first, understand the three stages
As house prices continue to adjust, another set of signals has emerged from Auckland’s residential construction sector.
According to an analysis published by Greg Ninness on interest.co.nz on 2 November, 13,771 new homes in Auckland received a Code Compliance Certificate, or CCC, in the 12 months to August 2026. The annual total rose for the second consecutive month, above the June low of 13,540 homes.
CCCs are an important indicator of completed housing supply, but they reflect work already completed and do not directly represent new orders secured by construction firms.
Understanding the construction cycle requires distinguishing three stages: building consent approval represents potential supply; the start of work marks entry into the construction phase; and a CCC indicates that the project has passed the relevant compliance checks.
There are time lags between these stages, and not every approved consent automatically becomes a completed home.
Ninness notes that Auckland’s annual number of new-home consents has gradually recovered since bottoming out in July 2024. If past trends in the conversion of consents into completions continue, annual completions could exceed 14,000 homes in early 2027 and reach around 15,000 by the end of 2027.
This is a projection based on historical trends. It still depends on project finance, construction progress and actual delivery, and should not be treated as a confirmed supply outcome.
Broader data also shows some improvement in construction activity. Stats NZ reported that construction activity, measured in GDP terms, grew 2.7% quarter on quarter in the second quarter of 2026, but was still down 1.1% year on year in the year to June. This shows that a quarterly recovery has emerged, while the industry’s annual performance remains in recovery.
Why are falling house prices and rising completions compatible?
The first reason is the time lag.
Homes receiving CCCs today may have had their land acquired, designs completed, finance arranged or consents obtained a year or two ago. Development decisions made then do not immediately disappear because valuations have recently fallen.
Residential projects also differ in cost and market positioning. At any given time, some projects may proceed because land costs are lower, the homes fit buyers’ budgets or financing arrangements are more robust. Others may be delayed by insufficient presales or narrowing margins.
A recovery in completions therefore shows that earlier construction work is being delivered, but does not by itself prove that developers are increasing investment across the board.
For construction firms, this distinction is particularly important: projects nearing completion bring finishing and handover work, while future orders depend on whether new projects can secure funding, sign contracts and actually start construction.
Will construction costs put a floor under house prices?
One finding in ANZ’s analysis that warrants the construction industry’s attention is that the gap between house prices and construction costs has narrowed significantly.
The house-price-to-construction-cost ratio cited by Galt fell from 2.1 in 2021 to 1.54 in June 2025. However, this data comes with a lag and cannot be treated as a real-time indicator of development margins at the end of 2026.
The economic logic is that if home sale prices keep falling while land, finance and construction costs cannot fall at the same pace, some new projects become unviable. If developers launch fewer projects, future supply could also decline, limiting the scope for further price falls.
However, construction costs cannot provide a clear price floor for every home.
The sale prices of existing homes are still affected by buyers’ purchasing power, sellers’ financial pressures, location and competing listings. There may be a substantial gap between the sale price a project needs to be profitable and what the market is willing to pay.
For developers, cost pressures are more likely to show up first as squeezed margins, adjustments to land offers or project delays, rather than automatic increases in sale prices.
YIJU’s view: opportunities come from more accurate assessments
YIJU believes the most significant feature of the current market is that prices, supply and project feasibility are adjusting at different speeds.
For owner-occupier buyers, a weaker market and potential new-home supply offer more scope to compare options. But falling regional valuations do not mean every listing offers the same room for negotiation. Buyers should still refer to actual sales in the same area with similar floor areas and tenure, comparing the total price, how well the home meets their living needs and the long-term costs of ownership.
For developers, deciding whether a project is worth starting requires a fresh check of target buyers and their budgets. Sales projections should include scenarios such as lower-than-expected sale prices, longer selling periods and rising finance costs to test whether the project can withstand changes. If a project can only be profitable with a significant rise in house prices, its land costs, product design and development timetable need reassessing.
For builders and materials suppliers, consents and CCCs can help indicate direction, but projects with confirmed finance, confirmed start dates, contract values and payment arrangements are closer to day-to-day business realities. Whether increased enquiries ultimately translate into reliable cash receipts will determine the quality of the recovery.
Auckland could deliver more new homes while still experiencing price adjustments. That combination will give buyers more choice and put development and construction firms’ costs and products under greater scrutiny.
The next things to track are whether new homes can find buyers within a reasonable time and whether new projects can remain viable at current sale prices and costs.