
When will commercial property recover from its crushing setback? Colliers International's 12-month analysis explains
Just how much has COVID-19 affected New Zealand's property market? From within the market, it can feel like being lost in a fog. Colliers International's latest report examines commercial and industrial property sales nationwide over the 12 months to June 2020, revealing the major shifts in market trends brought about by the pandemic.

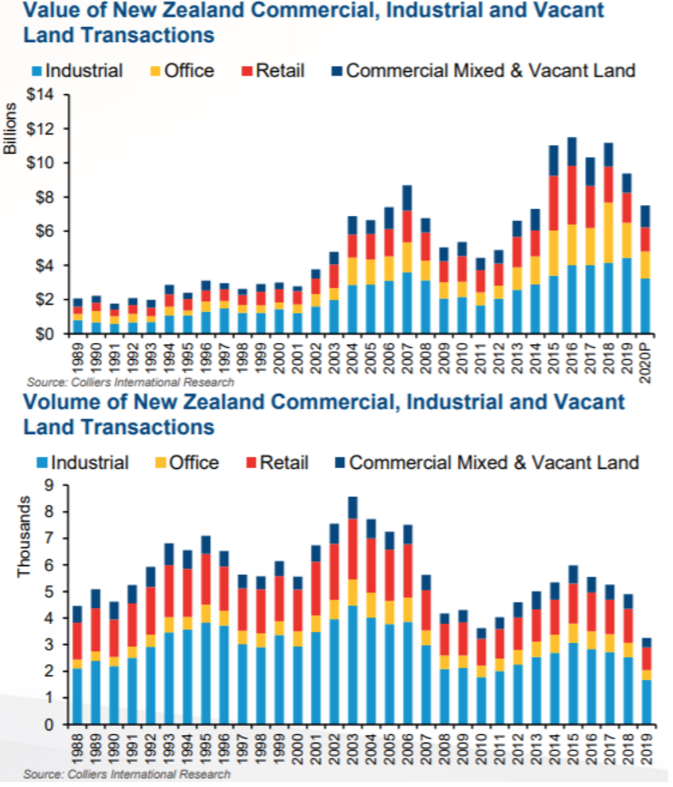
Colliers International's latest analysis of commercial and industrial property sales across New Zealand shows that 3,258 transactions were completed in the 12 months to June 2020, with a total value of NZ$7,500,000,000, well below previous years.
Industrial property accounted for 43% of total sales value and 51% of all transactions.
Sales plunge in the first half of the year An analysis over a longer period reveals how the enormous disruption caused by COVID-19 has brought different trends to the market.
During the 12 months to June 2020, nearly 75% of transactions were completed in the second half of 2019, accounting for around 72% of total sales value. In the first half of 2020, there were 814 transactions worth NZ$2,070,000,000, well below the preceding half-year.
Possible reasons for this market trend include:
- Many investors temporarily adopted a wait-and-see approach during the COVID-19 lockdown;
- There has been a lag in reporting data for the first half of 2020.
As 2020 draws to a close, total sales volumes and values are still expected to increase slightly. Barring surprises, however, both totals will fall below the annual results recorded in recent years.
Sales trends face unexpected disruption
Before COVID-19, sales trends were broadly similar to those seen in earlier periods of strong performance.
Although there were 260 fewer sales than in 2018, total sales value reached NZ$5,400,000,000, around 3.5% higher than in 2018.
Now consider this year's figures to June.
Sales are usually more active in the second half of the year than in the first. Over the past six years, the average difference between the two has remained at around 25%.
Had COVID-19 not caused unexpected disruption, and had this trend continued, sales value over the 12 months to June 2020 could have reached NZ$9,500,000,000. This would have been slightly above the NZ$9,370,000,000 recorded in the 12 months to June 2019.
{ad}
Industrial property continues to lead
The industrial sector continues to hold the largest share of the commercial property investment market. In the 12 months to June 2020, 1,675 industrial properties changed hands for a total of NZ$3,230,000,000.
The outlook for the sector remains positive, supported by factors including relatively low market risk and solid fundamentals.
In fact, demand for quality industrial property is high on both sides of the Tasman, not just in New Zealand.
Low-interest-rate policies from the Reserve Bank of New Zealand and Australia's central bank have continued to increase interest in the sector. As fundamentals improve, the sector's resilience further reduces the likelihood of risk.
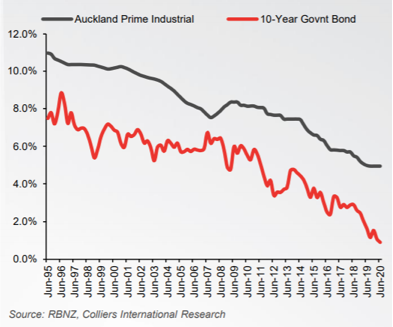
However, against an unsettled economic backdrop, competition for assets has intensified yield compression.
Evidence comes from June valuations released by Australian real estate investment trusts (REITs), which show that capitalisation rates compressed by an average of 12 basis points over the first six months of this year.
Reports on new listings in the sector released before New Zealand entered lockdown also showed a similar trend.
Subsequent sales further support the view that yields are continuing to compress. For example, the property at 83A Bodundary Rd, Papakura, sold at a yield below 5%, while the property at 63 Tidal Road, Mangere, sold for NZ$6,750,000 at a yield of just 4.96%.
Rapid growth in the retail sector
Before COVID-19, the retail sector recorded 650 transactions in the second half of 2019, with total sales of NZ$1,100,000,000. This was 17.8% higher than the corresponding period in 2018, and NZ$39,000,000 above the second half of 2017.
Given current conditions, the sector's short-term outlook may be less than encouraging. However, investors reluctant to take excessive risks may well return to the market in the near future when prices are right.
Meanwhile, large-format retail properties and some retail subsectors have proved exceptions, continuing to attract considerable investor interest.
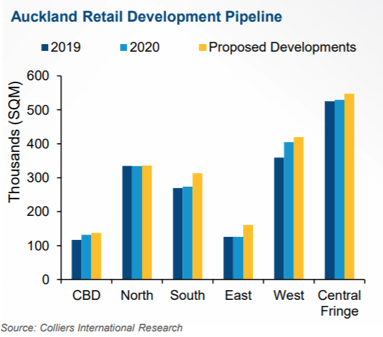
It is understood that by 2022 year-end, Auckland's retail market will have approximately 85,256 square metres of additional retail space, equivalent to 4.7% of the current retail space stock.
Shopping centres will contribute nearly 40% of the additional supply through extensions or new developments. Major shopping centre projects include:
- The redevelopment and expansion of Sylvia Park, adding 20,000 square metres;
- The Galleria shopping centre, developed by Kiwi Property;
- The 14,000-square-metre Ormistown Town Centre Mall, developed by Todd Property.
Development of large-format retail projects also remains at a high level. Supply was steady and strong in the first half of 2020, with total market stock increasing by 52,400 square metres. This included large furniture and hardware retailers Nido Furniture and Bunnings Westgate, and the Stoneridge retail precinct on Lunn Avenue.
However, retail development in prime CBD locations remains limited. Most of the additional space is concentrated around Wynyard Quarter and Westhaven, in preparation for next year's America's Cup.
Office property listings in short supply
In the second half of 2019, the office property market recorded 281 transactions, triple the number in the second half of 2018. Total sales in the second half of 2019 were NZ$1,100,000,000, similar to the retail sector.
2020 saw a limited number of office sales in its first half, but their total value was 485,000,000 New Zealand dollars. This figure partly reflects a reduction in the number of quality office properties listed for sale.
Office market sales hit a low during the lockdown in April 2020, falling to between -70% and -90% relative to baseline.
However, analysis of Google workplace mobility data for 25 September shows that the national figure has now returned to its original baseline (0%), although Auckland and Marlborough still lag behind the rest of the country.
An improvement is expected when Auckland moves down to Alert Level 1 this week, potentially taking the national market in a more positive, healthier direction.
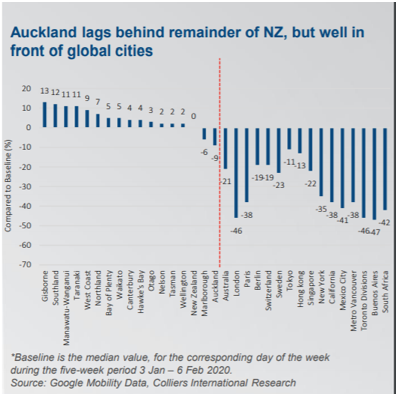
While workplace mobility continues to strengthen across New Zealand, Australia appears to remain well behind, currently at -21% relative to baseline, with Victoria at -45% and New South Wales at -14%.
Looking further afield, London is at -46%, Paris -38%, Berlin -19%, Switzerland -19%, Sweden -23%, Tokyo -11%, Hong Kong -13%, Singapore -22%, New York -35%, California -38%, Mexico City -41%, Greater Vancouver -38%, Toronto -46%, Buenos Aires -47% and South Africa -42%…
Many other major cities and regions around the world therefore show similarly clear trends, indicating that plans for a return to normal working life still face a long and uncertain road ahead.