
Will October’s property market go down in history? Experts predict an even busier November!
The Reserve Bank of New Zealand announced last week that it would investigate whether loan-to-value ratio (LVR) restrictions could be reinstated in March next year. Shortly afterwards, major commercial banks ASB and ANZ each announced they would reintroduce LVR restrictions for property investors without waiting for the Reserve Bank’s decision. Just how hot has the property market become for banks to be so eager to respond? The Real Estate Institute of New Zealand’s (REINZ) newly released October market report may offer an explanation.

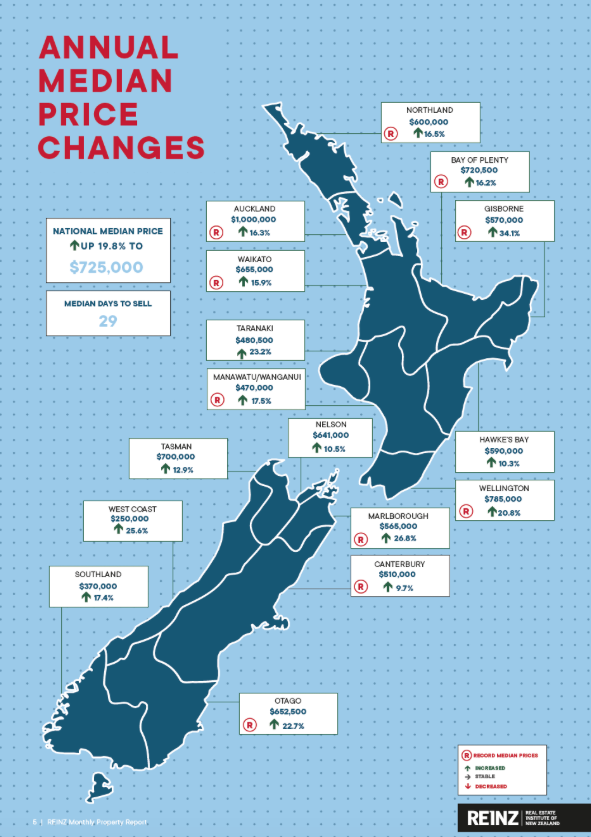
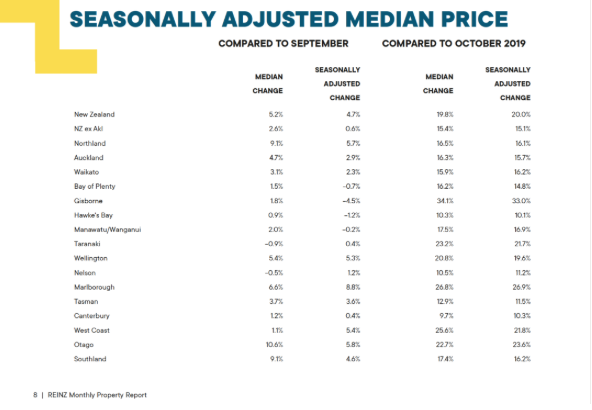
The latest figures from REINZ, the source of New Zealand’s most comprehensive and accurate property data, show that the national median house price reached a record NZ$725,000 in October. This was up 19.8% from NZ$605,000 in October 2019, and 5.2% above the NZ$689,000 recorded in September this year.
{ad}
- New Zealand’s median house price excluding Auckland reached a record NZ$600,000, up 4% from NZ$520,000 in October last year, and 2.6% above NZ$585,000 in September this year.
- Auckland’s median house price also reached a record, rising 3% from NZ$860,000 a year earlier to NZ$1,000,000. It was also up 4.7% from NZ$955,000 in September this year.
In October, 10 regions nationwide recorded all-time high median house prices. Alongside Auckland, these included Gisborne, Marlborough, Otago, Wellington, Manawatu–Wanganui, Northland, Bay of Plenty, Waikato and Canterbury.
Auckland house prices make history
REINZ chief executive Bindi Norwell said: “October 2020 will go down in residential property market history.”
During the month, the Auckland region’s median house price broke the million-dollar barrier for the first time. “With median prices above a million dollars in Auckland City (NZ$1,200,000), Manukau (NZ$1,001,000) and the North Shore (NZ$1,150,000), it is hardly surprising that the median for the entire Auckland region reached NZ$1,000,000,” Norwell said. “While this is an important milestone, it raises serious questions about future affordability for Aucklanders hoping to buy their first home. It also reinforces the importance of the current government reviewing legislation such as the Resource Management Act (RMA) as quickly as possible, so that more homes can be built faster and on a larger scale.”
Norwell said that, besides Auckland, another 9 regions and 28 districts within them recorded new median house price highs in October. Factors behind the trend included low interest rates, money intended for overseas travel being redirected into property investment, New Zealanders returning from overseas, the removal of LVR restrictions and a shortage of new listings. Together, these had created exceptionally fierce competition and continued price rises.
Given nationwide price increases over recent months, she said it was hardly surprising that the Reserve Bank would reinstate LVR restrictions before the 12-month period ended, particularly lending restrictions for property investors.
53 months’ highest property sales volume
In October, residential property sales nationwide rose 25.0% from 7,063 a year earlier to 8,830. This was the highest monthly volume in 53 months, since May 2016, and the strongest October in 14 years, since October 2006.
- Outside Auckland, sales rose 2% from 4,982 a year earlier to 5,690. This was the highest monthly volume in 43 months, since March 2017, and the strongest October in 14 years, since October 2006.
- Auckland’s October sales rose 9% year on year, from 2,081 to 3,140. This was the highest volume since March 2015, a period of 67 months, and the strongest October in 17 years, since October 2003.
Alongside Auckland, Gisborne, Waikato, Marlborough, the West Coast, Taranaki and Southland all recorded year-on-year sales growth of at least 20%.
Nelson was the only region nationwide to record a year-on-year decline in sales. Its October total was 101, one fewer than the 102 sold in October 2019. Wellington’s sales were unchanged from a year earlier at 750.
“New Zealand’s property market is extremely active at present, with more than 8,800 homes sold nationwide in October, an average of 283 a day. The last time we saw sales on this scale was May 2016, when the market was also very strong and prices were rising across many parts of the country.” Norwell believed steadily rising house prices were driving sales activity.
“More than half the country’s regions, 9 out of 16, recorded annual sales growth above 20% in October, exceeding everyone’s expectations. This shows how concerned many people are about future house prices, strengthening their resolve to buy now before prices potentially rise further.” Norwell predicted: “Auckland’s sales have increased by more than 50% year on year for two consecutive months, highlighting just how busy the market is. New listings in Auckland rose 36.8% in October, so the City of Sails’ property market could be even busier in November.”
House Price Index reaches another record
The REINZ House Price Index (HPI), which measures changes in property market values, rose 13.5% year on year in October to a record 3,248. The increase further demonstrates that insufficient supply is creating fierce competition in the property market, placing enormous pressure on prices.
- Outside Auckland, the HPI showed house prices rising 0% from October 2019 to a record 3,203.
- Auckland’s HPI rose 4% year on year to 3,304, also a record. This was the region’s strongest growth in 53 months, since May 2016, and the first time its growth ranked among the country’s top three in 59 months, since November 2015.
The regions ahead of Auckland for HPI growth in October were:
Gisborne/Hawke’s Bay, up 17.1% to a record 3488; and Wellington, up 16.7% to 3,331.
Two consecutive months of increases in the REINZ HPI demonstrate the strength of property markets across the country.
17 years’ fastest monthly selling time
Compared with October 2019, the national median time to sell a home last month fell by 5 days, from 34 to 29 days. This was the fastest October selling time in 17 years.
- Outside Auckland, the median time to sell fell by 3 days, from 32 to 29 days, the lowest October figure in 17 years.
- Auckland’s median time to sell fell from 36 to 30 days, down 6 days year on year and the lowest in 51 months.
Even Northland, which had the country’s longest selling time, recorded just 39 days, down 21 days from a year earlier and its lowest level in 13 years.
“For the first time on record, no region had an average selling time above 40 days, showing the urgency with which people are buying property in the current market. But taking time to do your homework and avoiding buying blindly is just as important as making quick, decisive decisions,” Norwell warned.
5 months’ first month-on-month increase in inventory
The total number of properties available for sale nationwide fell 18.7%, from 22,313 in October 2019 to 18,141 in October this year. Inventory also reached record lows in 5 regions: Bay of Plenty, Marlborough, Northland, Southland and Waikato. However, October inventory rose 3.2% from the previous month, the first increase in 5 months.
Nearly a quarter of homes sold at auction
In October, 23.4% of all homes sold went through auction, representing 2,068 properties. This was up 15.0% from a year earlier, when 1,062 properties sold at auction in October 2019. The auction share in September this year was 16.2%. This was the highest auction percentage in New Zealand’s property market in 49 months, since September 2016.
Gisborne had the highest auction share at 74.6%, representing 47 properties, although this was below September’s record 75.0%.
Auckland had the country’s second-highest auction share at 40.6%, or 1,276 properties, a substantial increase from 26.6%, or 553 properties, a year earlier. This was Auckland’s highest proportion of auction sales in 47 months, since November 2016.
Share of lower and middle-priced homes continues to fall
Nationwide, the share of homes sold for less than NZ$500,000 fell from 34.2%, or 2,419 properties, in October 2019 to 22.3%, or 1,970 properties, in October 2020.
The share of homes sold for between NZ$500,000 and NZ$750,000 fell from 33.3%, or 2,350 properties, a year earlier to 30.4%, or 2,682 properties.
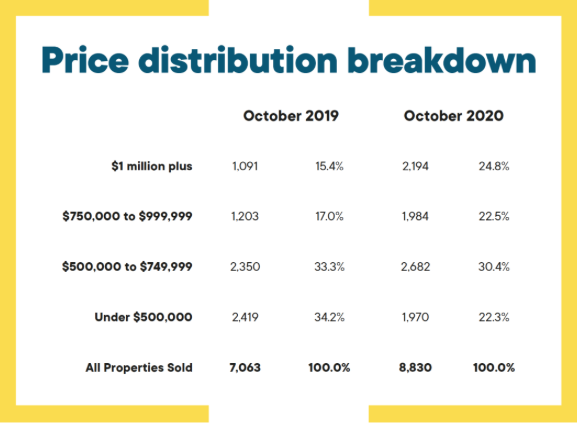
At the top end of the market, the share of homes sold for NZ$1,000,000 or more rose from 15.4%, or 1,091 properties, in October 2019 to 24.8%, or 2,194 properties, in October 2020. This was the highest percentage on record.