
Another large-section property sets a new benchmark: Do you believe Auckland house prices are cooling?
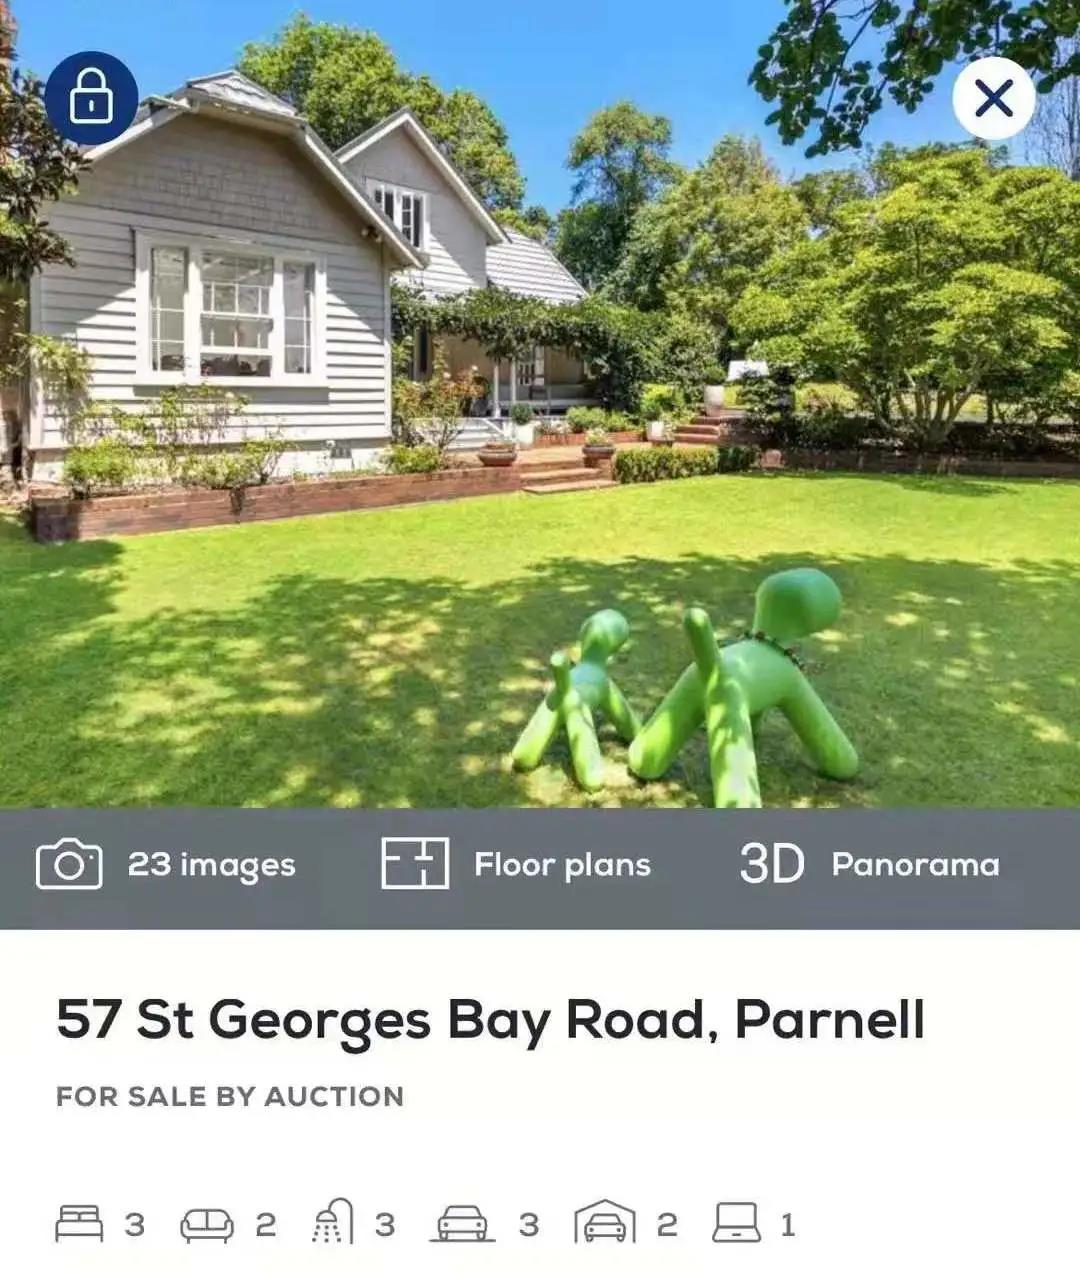
Yesterday, some media outlets cited a particular figure from the latest Real Estate Institute of New Zealand (REINZ) report to suggest Auckland house prices were cooling. This morning, an old three-bedroom house on a 1518-square-metre section in Parnell fetched 7,200,000 at auction, more than NZ$1,000,000 above its capital valuation (CV). Do you believe the housing market is slowing? Rather than drawing conclusions from a partial picture, let us look at the full report.
According to the latest Real Estate Institute of New Zealand (REINZ) data, the property market in January 2021 was busier and more active than in the same period in previous years.
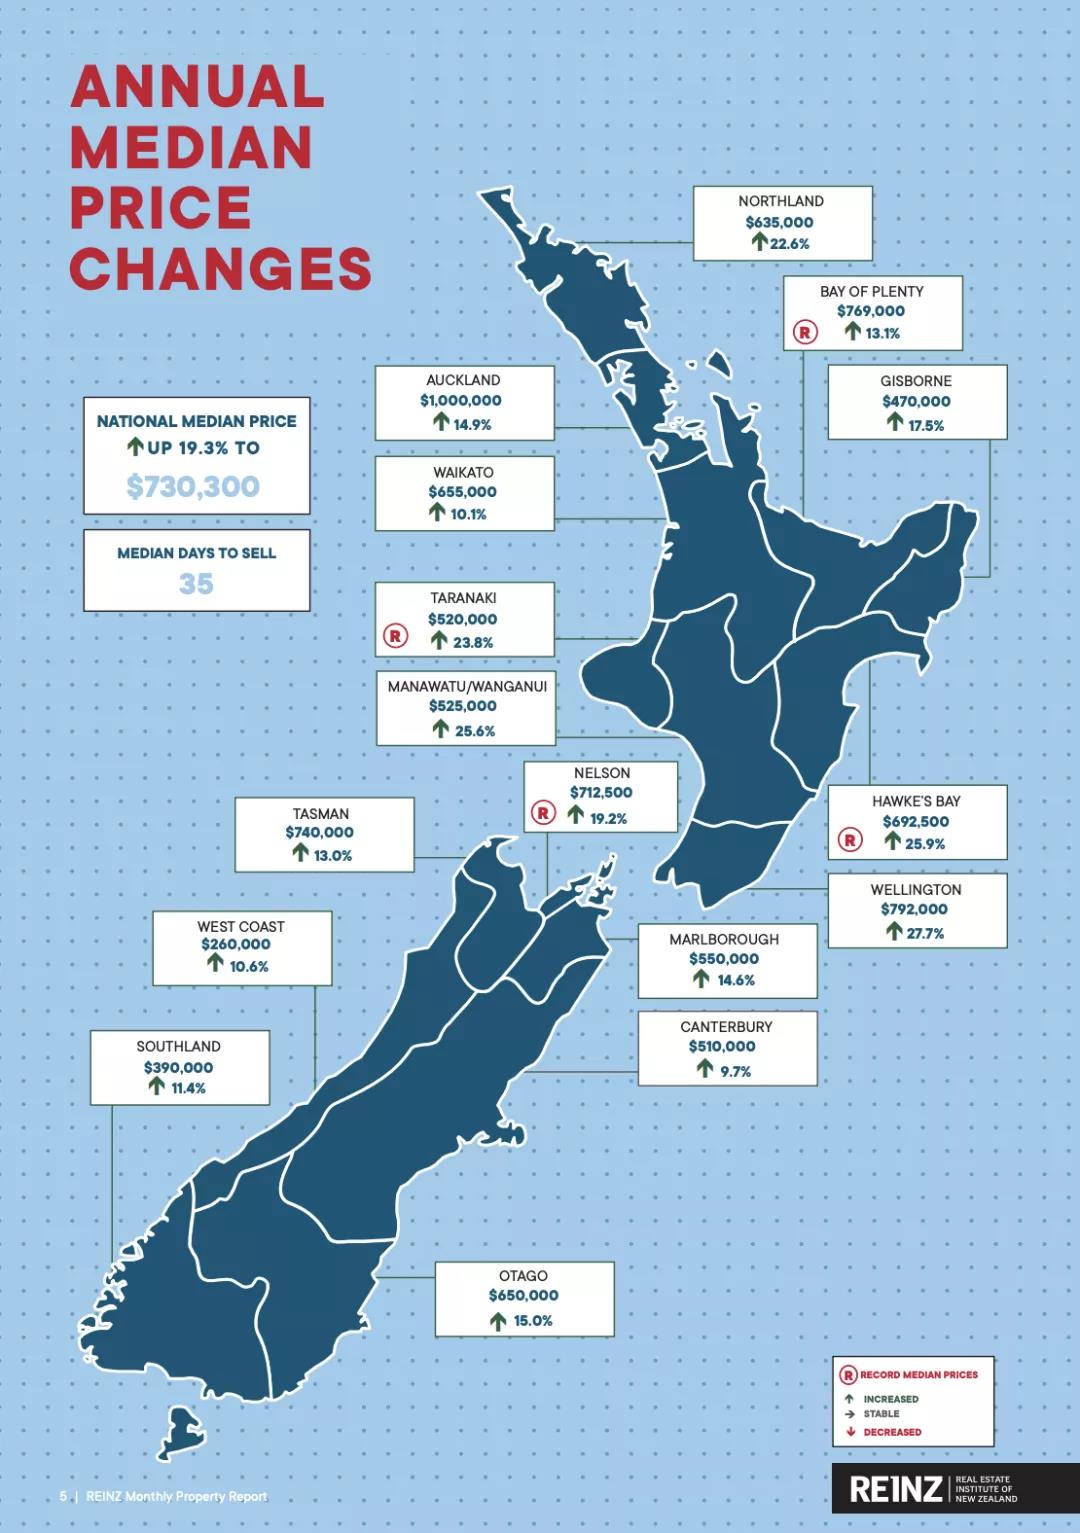
New Zealand's median house price rose from NZ$612,000 in January 2020 to NZ$730,300 in January 2021, an increase of 19.3%. Within this:
- The median house price outside Auckland rose from NZ$525,000 in January last year to NZ$602,000, an increase of 7%.
- Auckland's median house price increased from NZ$870,000 in the same period last year to NZ$1,000,000, a rise of 9%.
{ad}
In January, 4 regions recorded new all-time median price highs:
- Bay of Plenty: NZ$769,000, up 1% year on year.
- Hawke's Bay: NZ$692,500, up 9% year on year.
- Taranaki: NZ$520,000, up 8% year on year.
- Nelson: NZ$712,500, up 2% year on year.
Manawatu/Wanganui's median house price also matched its record high of NZ$525,000, set in December 2020.
Real Estate Institute of New Zealand (REINZ) chief executive Bindi Norwell said: “Usually in January, residential market activity slows and prices dip slightly as people head to the beach for their holidays. However, the first month of 2021 was unusual, with house prices continuing to rise across the country.”
Norwell said that as property sales continued to grow rapidly, concerns about future price increases and widespread fear of missing out were directly influencing purchasing behaviour. This made last month the fastest-selling January in 17 years, and continued to influence prices. “Prices in Auckland cooled slightly compared with the record high set in December 2020. However, seasonally adjusted figures show prices were actually higher than normally expected at this time of year (+1.7%).”
Highest January sales in five years
The number of residential properties sold across New Zealand in January increased by 3.2% year on year, from 4,802 to 4,957. This was the highest January sales volume in 5 years.
- Outside Auckland, the number of homes sold fell by 3% year on year, from 3,443 to 3,087, reaching the lowest January sales volume in 7 years. It was also the first year-on-year decline in 8 months.
- Auckland sales increased by 6% year on year, from 1,359 to 1,870, reaching the highest January sales volume in 14 years.
Outside Auckland, 6 regions recorded year-on-year sales growth in January: West Coast, up 54.1%; Southland, up 18.4%; Gisborne, up 7.7%; Canterbury, up 6.4%; Northland, up 3.8%; and Waikato, up 2.8%.
At the same time, however, 7 other regions recorded their lowest January sales volumes in years: Wellington, Tasman, Hawke's Bay, Marlborough, Otago, Manawatu/Wanganui and Taranaki.
“January home sales were the highest in five years. Across the country, however, results varied: some regions recorded their highest January sales volumes in years, while others recorded their lowest January sales volumes in years. This clearly shows that some regions had a steady flow of new listings in month 11 and December last year, allowing them to stand out in sales. In other regions, we can already see the market effects of persistently low additions to listings and a shortage of total stock.
Norwell noted that New Zealand had more than 1400 additional new listings in January 2021 compared with December 2020, and that attendance at open homes and on-site auctions had been very strong heading into February. She did not expect this to last long, “simply because a sizeable proportion of buyers are currently trying to purchase before LVR restrictions are reinstated”.
Turning to Auckland, Norwell said it was among the markets with the strongest year-on-year sales growth. In particular, both the North Shore and Manukau City recorded annual sales increases of more than 50%. “This shows that demand is very strong in these popular parts of Auckland.”
“Looking ahead over the next few months, we expect sales to continue at a reasonable pace. But as we have said before, this will again depend on new listings remaining at reasonable levels, as well as recent developments in the pandemic,” Norwell concluded.
HPI reaches a new high
The REINZ House Price Index (HPI), which measures changes in property values across New Zealand, rose 19.2% year on year in January to 3,482, setting another all-time high. This was the largest increase in 199 months, since June 2004.
- Outside Auckland, the HPI showed a year-on-year price increase of 4%, reaching 3,518. This was the largest increase in 197 months, since August 2004.
- Auckland's HPI rose 7% year on year to 3,436.
In January, Gisborne/Hawke's Bay again recorded the largest annual HPI increase, up 30.7% to a record 4,012. Manawatu/Wanganui and Wellington shared second place, with annual growth of 26.0%. Wellington reached an all-time high of 3,717, and its 26.0% increase was also the largest in the history of its HPI.
Lowest average selling time in 17 years
In January, the average time taken to sell a home nationwide fell from 42 days in January 2020 to 35 days. This was the fastest-selling January in 17 years.
- Outside Auckland, the average selling time fell from 42 days to 35 days, making this the fastest-selling January in 17 years.
- Auckland's average selling time fell from 43 days to 35 days, making this the fastest-selling January in 6 years.
Seven regions—Bay of Plenty, Hawke's Bay, Manawatu/Wanganui, Northland, Taranaki, Tasman and Waikato—recorded their lowest average January selling times since REINZ records began. West Coast and Wellington also recorded their lowest average January selling times in 25 and 37 years respectively.
Stock levels fall year on year but rise month on month
If there was good news in January, it was that although the total number of homes available for sale in New Zealand in January fell 20.6% year on year, from 19,488 to 15,480, it had increased from the record low stock level in December last year.
No region recorded an increase in stock compared with January 2020. Manawatu/Wanganui had just 4 weeks of housing stock, the lowest in New Zealand and a record low for the region. Taranaki followed with 5 weeks, then Wellington with 7 weeks. This was the first time in 6 months that Wellington did not have the lowest figure.
Highest auction share on record
In January, 796 homes sold at auction, accounting for 16.1% of total sales, compared with just 6.5% (312 homes) in the same period last year. This was the highest auction share of total sales recorded for January. The leading regions were Gisborne, with an auction share of 32.1%, and Bay of Plenty, with 28.9%.
- Outside Auckland, 1% of homes sold at auction, up from 3.4% in the same period last year.
- Auckland ranked third nationwide, with auctions accounting for 6% of sales (516 homes), up from 14.3% (194 homes) in the same period last year. This was its highest auction share on record for January.
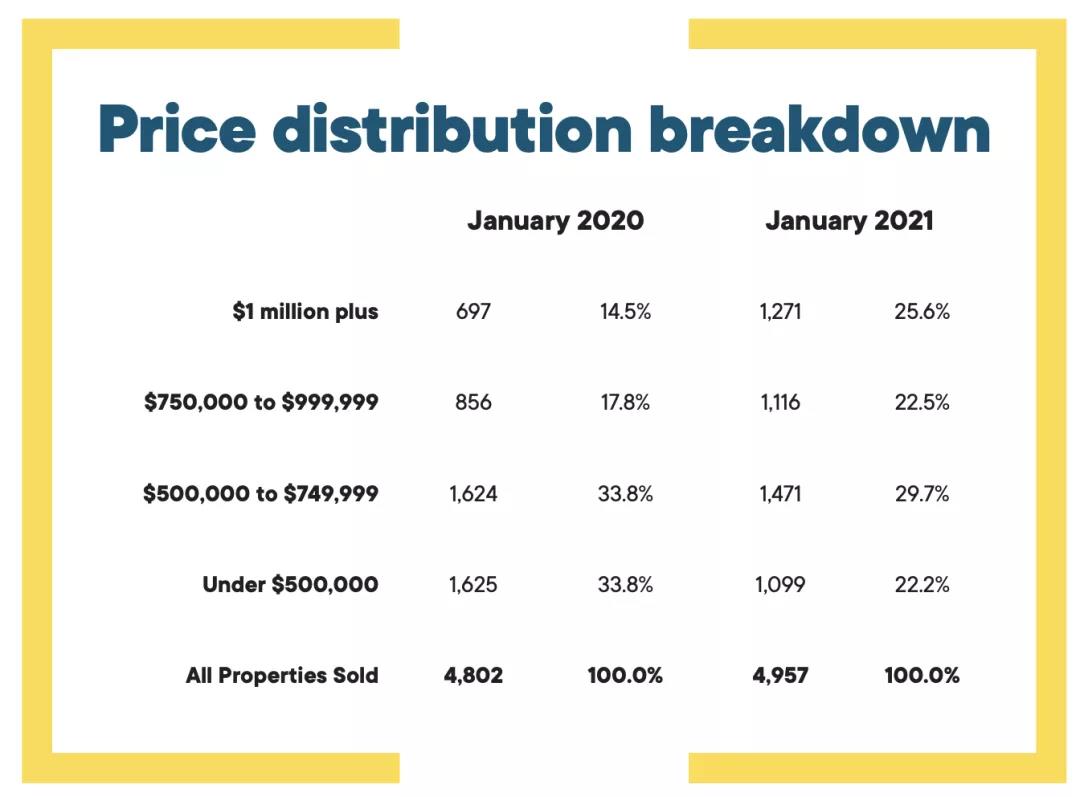
Sales split roughly evenly across four price bands
Among homes sold nationwide in January, the share selling for less than NZ$500,000 fell from 33.8% (1,625 homes) in January 2020 to 22.2% (1,099 homes) in January 2021.
The share of homes in the NZ$500,000–750,000 price band fell from 33.8% (1,624 homes) to 29.7% (1,471 homes).
At the upper end of the market, the share of homes selling for NZ$1,000,000 or more rose from 14.5% (697 homes) in January 2020 to 25.6% (1,271 homes) in January 2021.