Bad news! Housing affordability for first-home buyers has worsened compared with three years ago
New Zealand financial information website interest.co.nz has tracked and studied housing affordability for local first-home buyers each month since 2004. Its latest mortgage affordability report shows that buying a home is now more difficult for local first-home buyers than it was three years ago.

New Zealand financial information website interest.co.nz has tracked and studied housing affordability for local first-home buyers each month since 2004. Its latest mortgage affordability report shows that buying a home is now more difficult for local first-home buyers than it was three years ago. The report says major changes in mortgage rates meant these buyers had far less opportunity to purchase a home in September this year than in September 2019.
{ad}
Mortgage rates are not the only driver of property transactions, but they are among the most important. Whether the buyer is a homebuyer or a developer, most property transactions rely heavily on borrowing. Changes in mortgage rates, whether up or down, therefore have a direct impact on borrowing levels and repayment costs.
Let us look at the major commercial banks' two-year fixed mortgage rates and how they have changed over the past three years. In September 2019, before the pandemic, the average two-year fixed rate at the major banks was 3.50%.
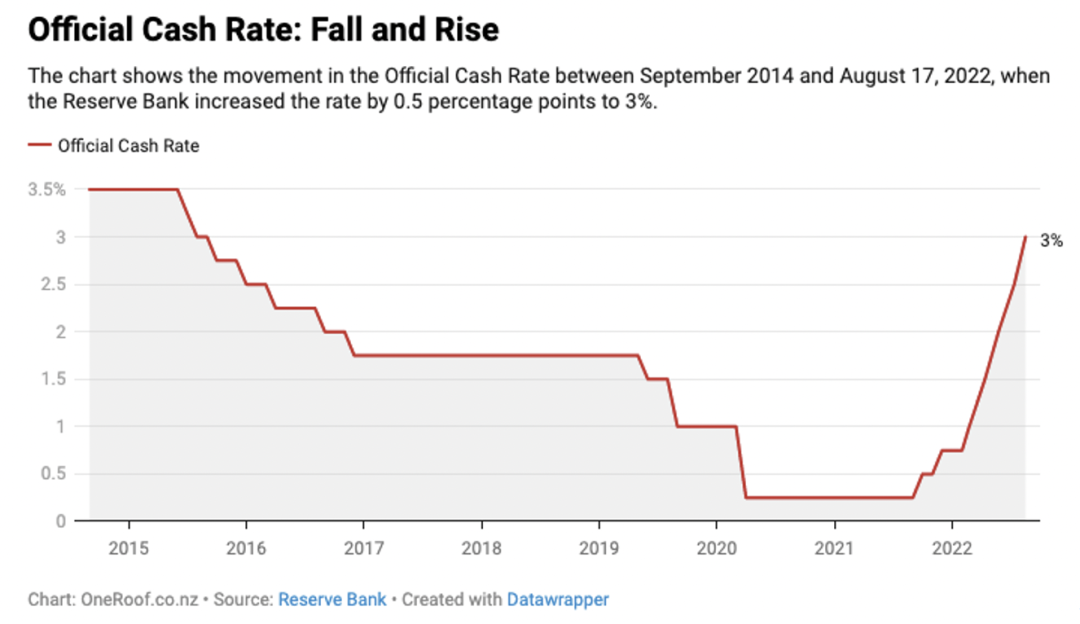
2015 to 2022 year OCR trend chart
Over the following 20 months, as the COVID pandemic dealt a heavy blow to New Zealand's economy, the Reserve Bank repeatedly lowered the official cash rate to a historic low of 0.25%. By May 2021, the average two-year fixed rate had fallen to an all-time low of 2.52%. Mortgage rates then began rising rapidly, with the average two-year fixed rate reaching 5.47% in September this year. In the latest round of bank rate increases, many banks have already raised their two-year fixed rates to 6.19%, the highest level in nearly a decade, and the peak still appears a long way off.
So just how much do mortgage rates affect affordability for first-home buyers?
Because first-home buyers generally choose less expensive homes, the Mortgage Affordability Report focuses on buyers purchasing properties in the lowest-priced 25% of the market.
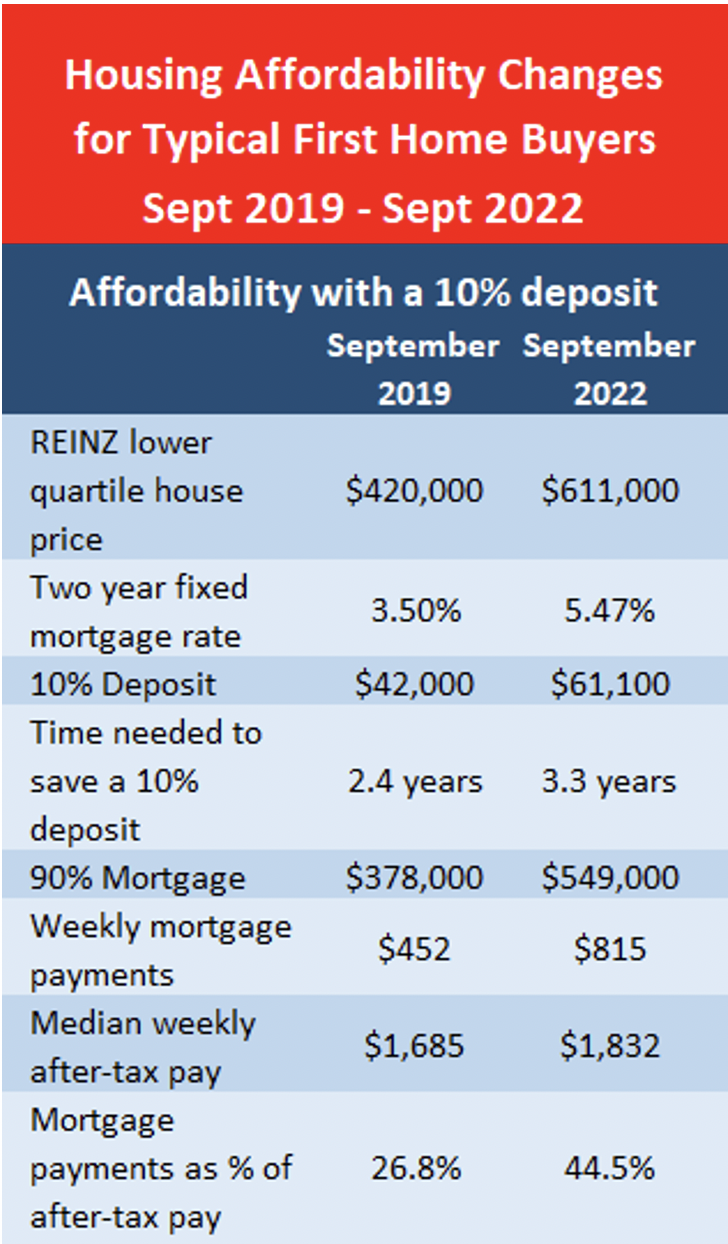
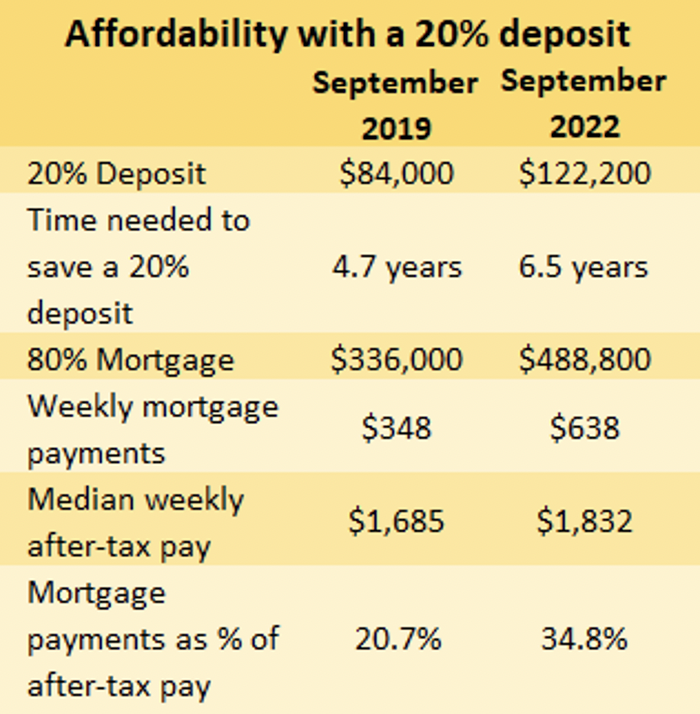
With 10% or 20% deposits: an affordability comparison for first-home buyers
In September 2019, the average price of homes sold in the lowest-priced 25% of New Zealand's market was NZ$420,000. After 20 months of persistently low mortgage rates, the housing market experienced an unprecedented boom and prices rose with it. In November 2021, the average price of homes sold nationwide in the lowest-priced 25% reached a peak of NZ$670,000. Although the average purchase price for these buyers fell back to NZ$611,000 last month, it was still NZ$191,000 higher (+45%) than 3 years earlier.
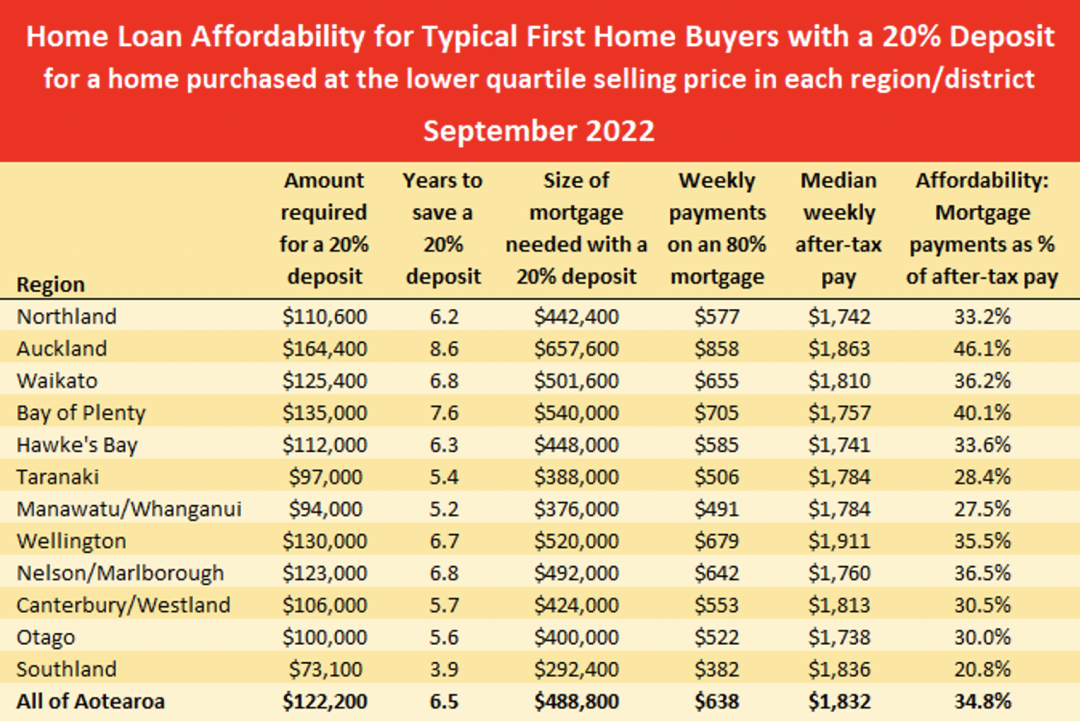
In September 2019, first-home buyers purchasing in the lowest-priced 25% of the market needed NZ$42,000 for a 10% deposit. By September 2022, that figure had risen to NZ$611,000. If the deposit required for the same property over that period was 20%, the amount would have increased from NZ$84,000 to NZ$122,000.
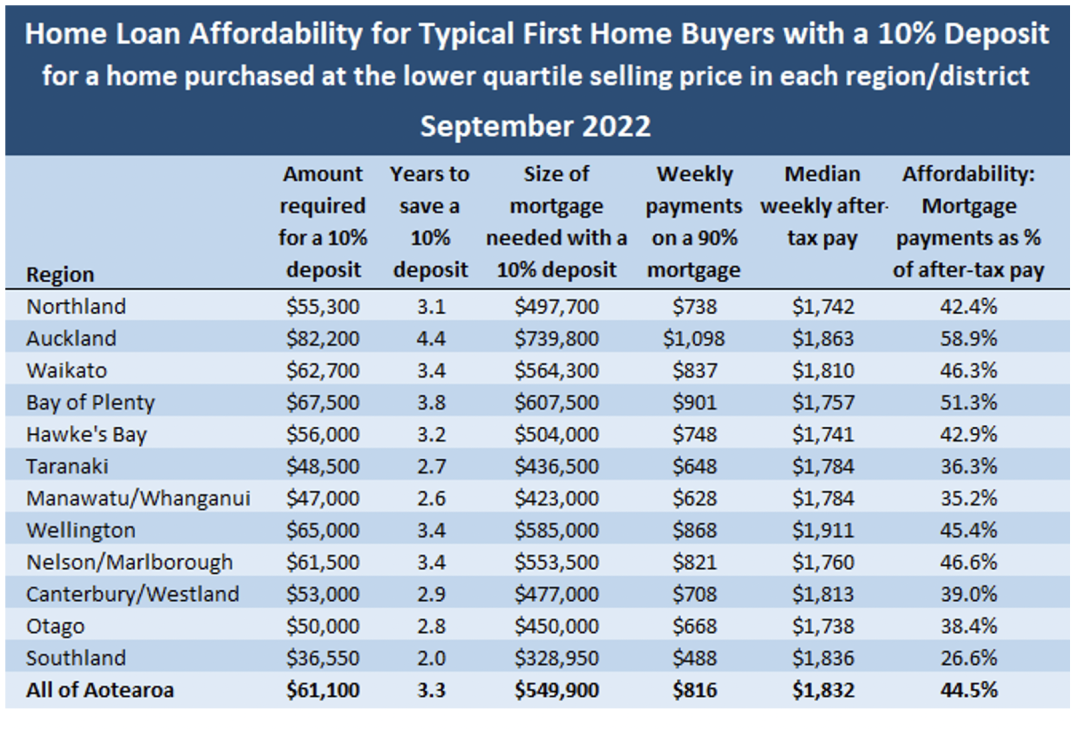
This also means the mortgage debt first-home buyer households needed to take on to complete settlement rose from NZ$378,000 in September 2019 to NZ$549,000 in September 2022 with a 10% deposit, or from NZ$336,000 to NZ$488,800 with a 20% deposit. Borrowers' corresponding weekly repayments would therefore jump from NZ$452 to NZ$816, an increase of +80.5% with a 10% deposit, or from NZ$348 to NZ$638 a week, an increase of 83.3% with a 20% deposit.
Can all first-home buyer households comfortably cope with such a large increase in borrowing costs?
The answer is certainly no. The Mortgage Affordability Report's survey of median after-tax earnings for couples aged 25–29 shows that, where both partners worked full-time, average household disposable income was NZ$1685 a week in September 2019. By September 2022, weekly income for couples in this age group had risen by just NZ$147 (+8.7%) to NZ$1832. Yet they would need to devote an additional NZ$364 a week to mortgage repayments with a 10% deposit, or NZ$290 with a 20% deposit.
If those figures do not convey the seriousness of the problem, let us calculate it another way. In September 2019, mortgage repayments took up 26.8% of household income for first-home buyers purchasing in the lowest-priced 25% of the market with a 10% deposit. By September this year, that figure had soared to 44.5%. For those choosing a 20% deposit, repayments rose from 20.7% to 34.8% of household income over the same period.
It is clear that housing affordability for first-home buyers has deteriorated considerably over the past three years. Although house prices have begun easing since the end of last year, earlier price rises were so large and mortgage rates have risen so quickly that the benefit of modest house price falls has been erased.
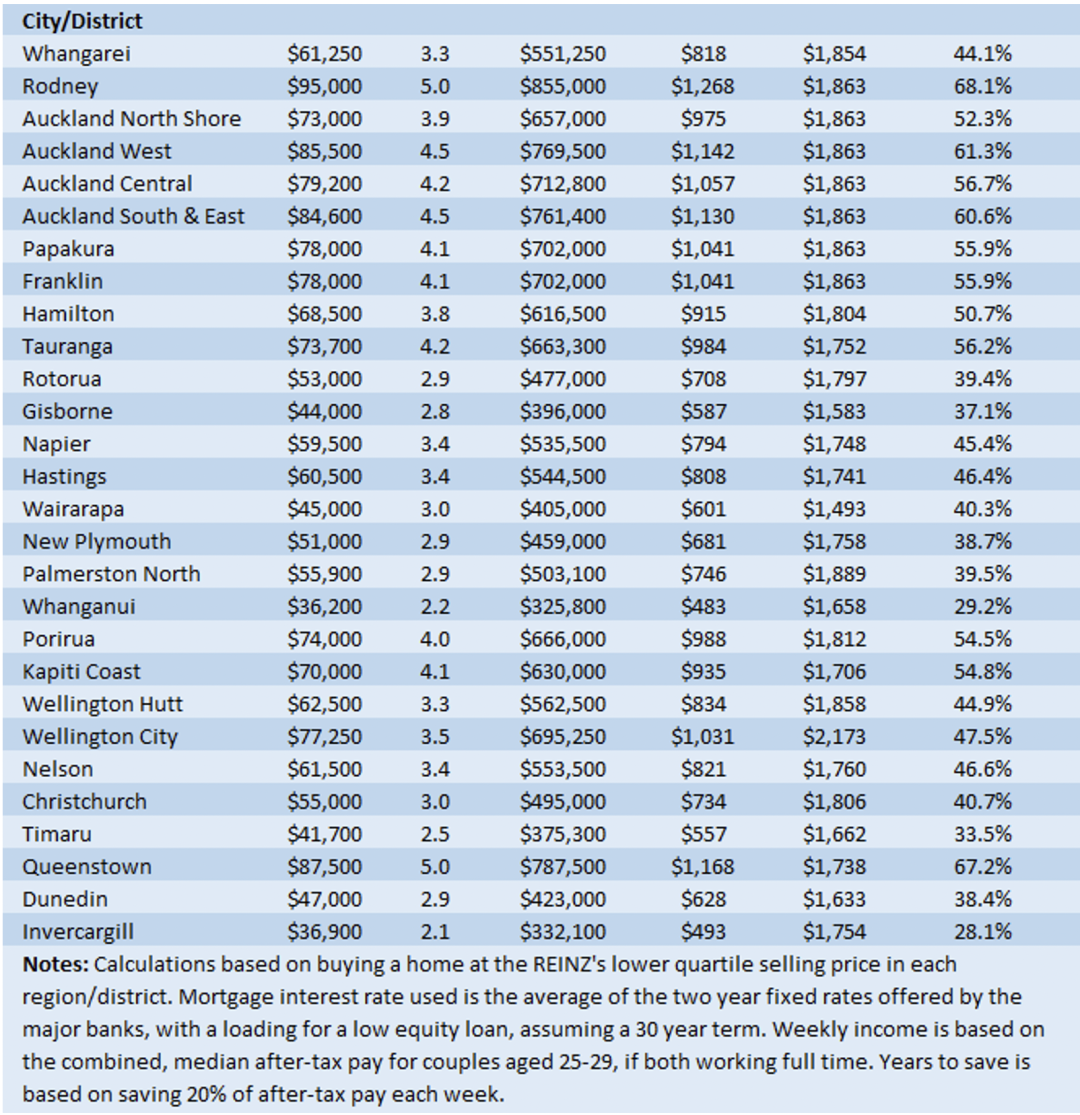
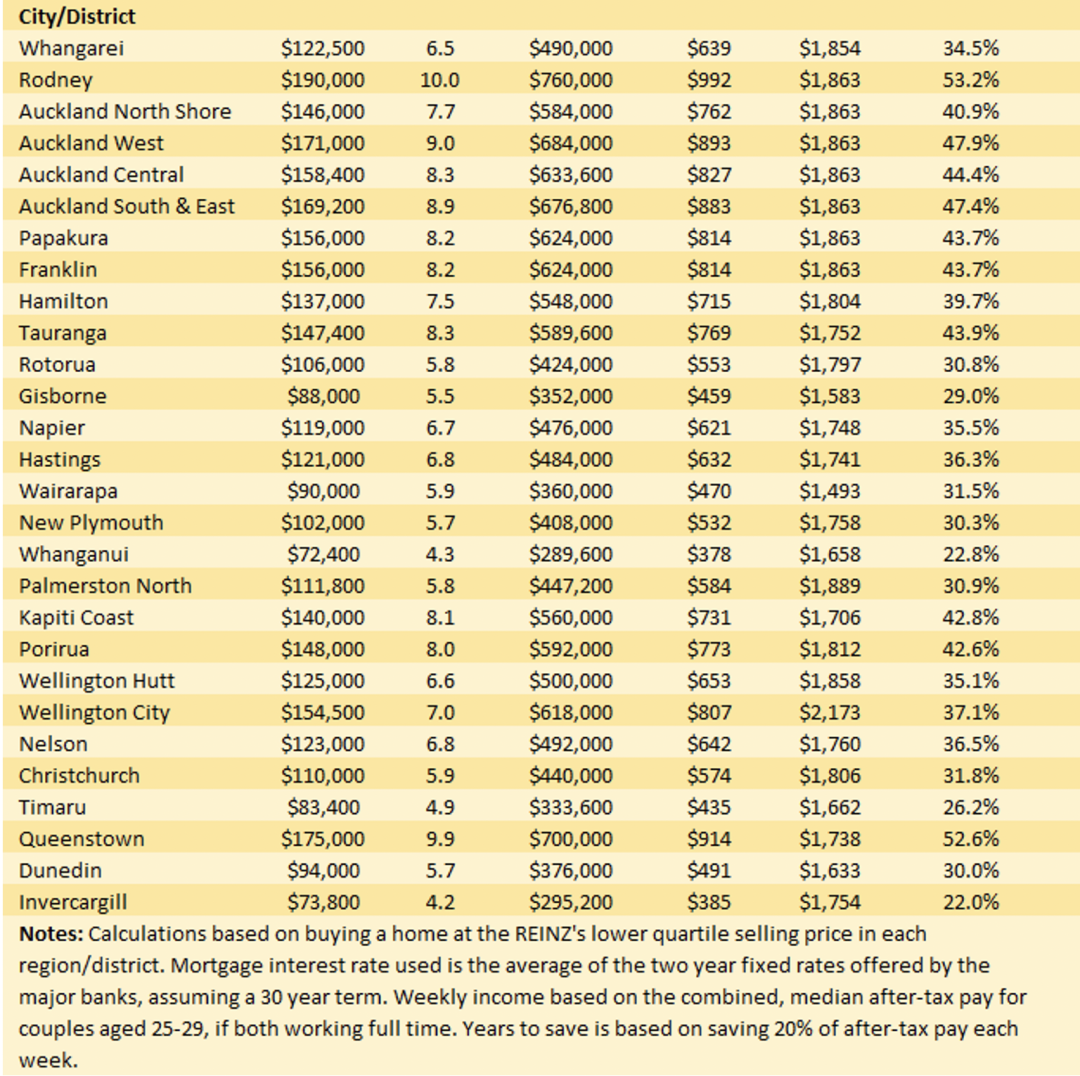
More concerning still, the report's figures are national averages. In higher-priced cities and regions such as Auckland, Waikato, Bay of Plenty, Wellington and Nelson/Marlborough, housing unaffordability is even more pronounced for first-home buyers.
In Auckland, for example, first-home buyer households aged 25–29 purchasing in the lowest-priced 25% of the market with a 10% deposit of NZ$82,000 would need to spend as much as 58.9% of their median household income on mortgage repayments. That repayment burden is unaffordable for ordinary wage-earning households. In these regions, owning a home is therefore increasingly becoming a privilege reserved for high-income earners. The chart below shows affordability figures for first-home buyers purchasing in the lowest-priced 25% of the market with 10% or 20% deposits across all major New Zealand cities and regions in September 2022.