
Last month's latest house price report is out: when will this downturn end?
OneRoof-Valocity recently released its latest New Zealand house price index report for October in the year 22. The figures show that the national average house price fell 2.7%, or NZ$28,000, over the 12 months to the end of October, bringing the average to NZ$1,009,000. This was the first annual decline in house prices since July 2011.

OneRoof-Valocity recently released its latest New Zealand house price index report for October in the year 22. The figures show that the national average house price fell 2.7%, or NZ$28,000, over the 12 months to the end of October, bringing the average to NZ$1,009,000. This was the first annual decline in house prices since July 2011.
{ad}
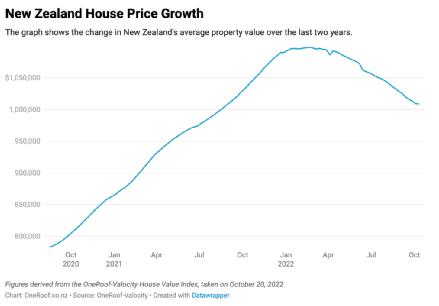
Chart of New Zealand house price growth over the past two years
Greater Wellington has been hardest hit, with its average house price falling 13.1% (NZ$142,000) over the past 12 months to NZ$940,000. There is no sign yet of the decline slowing: prices fell by as much as 8.2% (NZ$83,000) over the latest three-month period, bringing the total decline since the March peak to 17%. Other regions recording annual declines in the year to October were Auckland (down 5.5% to an average of NZ$1.398 million); Manawatu-Whanganui (down 4.5% to NZ$633,000); Hawke's Bay (down 4% to NZ$833,000); Nelson (down 2.9% to NZ$832,000); and Bay of Plenty (down 0.2% to NZ$1,002,000). The West Coast was the only region where prices rose over the past three months, up 2.7% (NZ$11,000) to an average of NZ$414,000.
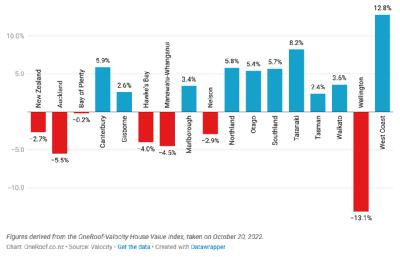
Chart of house price changes across New Zealand regions over the 12 months to the end of October this year
Of the country's 72 districts, 15 recorded house price growth in the three months to the end of October. Opotiki in the Bay of Plenty recorded the largest increase, with its average house price rising 9.7% to NZ$666,000. Other relatively strong performers included Hurunui in Canterbury (up 5.7% to NZ$700,000); Westland on the West Coast (up 3.9% to NZ$458,000); and Buller on the West Coast (up 3.5% to NZ$385,000). Although house prices rose in most parts of the country over the past year, the gains are getting smaller. The largest annual declines were in Greater Wellington (down 13.1%), Palmerston North (down 8.4%), Napier (down 8.2%) and Dunedin (down 6.1%).
Turning to nationwide property sales, 90687 properties sold in the year to the end of October, down from 93847 in the 12 months to the end of September. Sluggish sales have also spread across most of the country. Of the 2265 suburbs with sales activity over the past 12 months, only 905 recorded at least 20 property sales. That was 9 fewer suburbs than at the end of September and 109 fewer than at the end of March. Of these 905 suburbs, only 88 recorded quarterly house price growth, while 445 recorded annual declines in their average house prices.
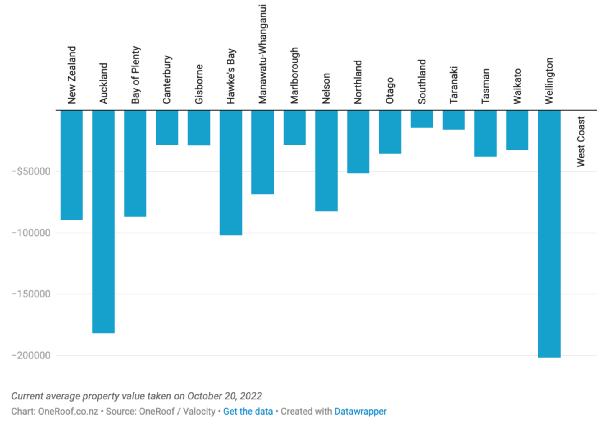
Chart showing changes in current house prices compared with the market peak
James Wilson, head of valuations at OneRoof's data partner Valocity, said New Zealand house prices continued to fall in October. They were down 4.1% (NZ$43,000) since July, bringing the total decline since the market peak in February this year to 8.6% (NZ$95,500). They had also observed that the pace of decline was accelerating, with the fall in average house prices increasing from 3.7% three months earlier to 4.1% in October. He was concerned that the national average house price might already have fallen below the NZ$1,000,000 mark.

James Wilson, head of valuations at OneRoof's data partner Valocity
Wilson believed new listings would increase as New Zealand's traditional peak property season arrived, but this was not necessarily good news for the market. In a buyer's market already oversupplied with properties, more new listings would only shift the balance further towards buyers. As the OCR (Official Cash Rate) and CPI (Consumer Price Index) continued to rise, borrowers would face higher mortgage stress-test rates when applying for loans, further reducing buyers' purchasing power. With buyers enjoying more choice and no longer driven by FOMO (fear of missing out), the time taken to sell newly listed properties would also increase substantially.
Investors should note that inflation remains above the Reserve Bank of New Zealand's expectations, potentially leading to further OCR increases. Uncertainty in global investment markets is adding further pressure to the property market by hampering KiwiSaver returns, leaving first-home buyers with less money available to withdraw for their first purchase. He concluded that all of this pointed to New Zealand house prices continuing to fall into 2023.
Valocity's head of research, Wayne Shum, added that another figure that could not be ignored was the 12% quarterly decline in mortgage registrations. Nationwide, although first-home buyer registrations fell substantially by 2437 compared with the corresponding market period, first-home buyers remained the dominant group applying for mortgages. Their market share rose from 38% last quarter to 39.3% this quarter, while investors' share remained similar to the previous quarter at 25.4%.