
Still waiting for house prices to fall? Data shows some buyers are quietly making their move…
As the interest rate hiking cycle nears its end, New Zealand house prices are already around the bottom. As with every historical market bottom, its arrival is quiet.

As the interest rate hiking cycle nears its end, New Zealand house prices are already around the bottom. As with every historical market bottom, its arrival is quiet.
This is because a true market bottom comes with virtually no sales activity, with only a small number of people buying and selling. Pinpointing the lowest point is therefore practically impossible. However, some data that leads the market does reveal that people are quietly making their move. Let us look at the figures:
Some forward-looking data
Data point 1
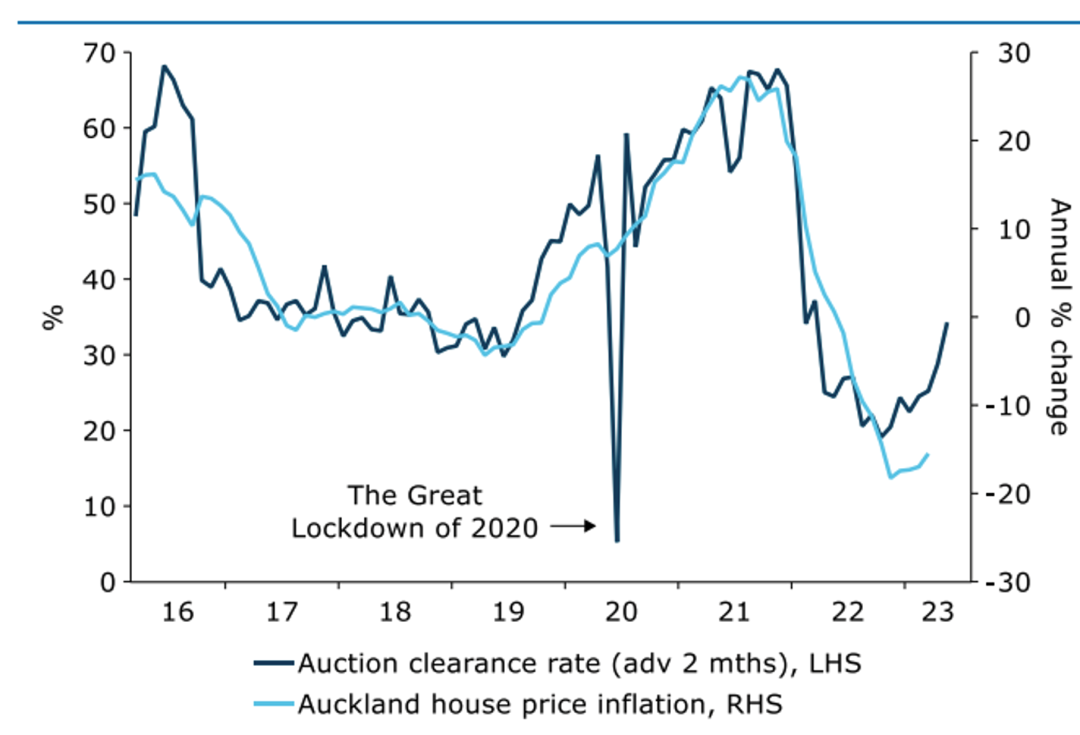
Auckland’s residential auction clearance rate has been rising for several months
Historical data shows clearance rates generally lead prices by around 3 months. In the chart above, the curve has been shifted forward by 2 months to make comparison with actual house price growth easier. The adjusted auction clearance rate closely tracks price movements, making it a meaningful leading indicator.
At the bottom of the market, sellers abandon their final resistance and accept buyers’ offers, while buyers stop seeking lower prices and commit to purchases. This gradually lifts clearance rates. Auckland’s clearance rate has now been rising for nearly 4–5 months, during which house prices have been flat or changed only slightly.
As clearance rates rise, the supply of desirable properties will gradually be exhausted and buyers will compete for them. Buyers, especially owner-occupiers, need to seize opportunities to buy now.
Data point 2
Sales volumes remain below historical levels but are rising rapidly
In the chart above, the dark blue line shows historical average sales volumes, while the green band shows their main historical range. Changes in sales volumes lead the market by around 3 months. The orange line shows changes in sales volumes in the first quarter of this year.
A comparison with 2020, 2021 and 2022 shows that sales volumes in quarter 1 this year were very low and below the historical range overall, which is highly consistent with a market bottom.
However, the pace of growth since March, reflected in the overall slope, has been significant, exceeding that of the past 3 years. A single month’s change may not establish a new trend, but alongside the sustained rise in clearance rates in the first data point, this change in sales volumes deserves attention.
Data point 3
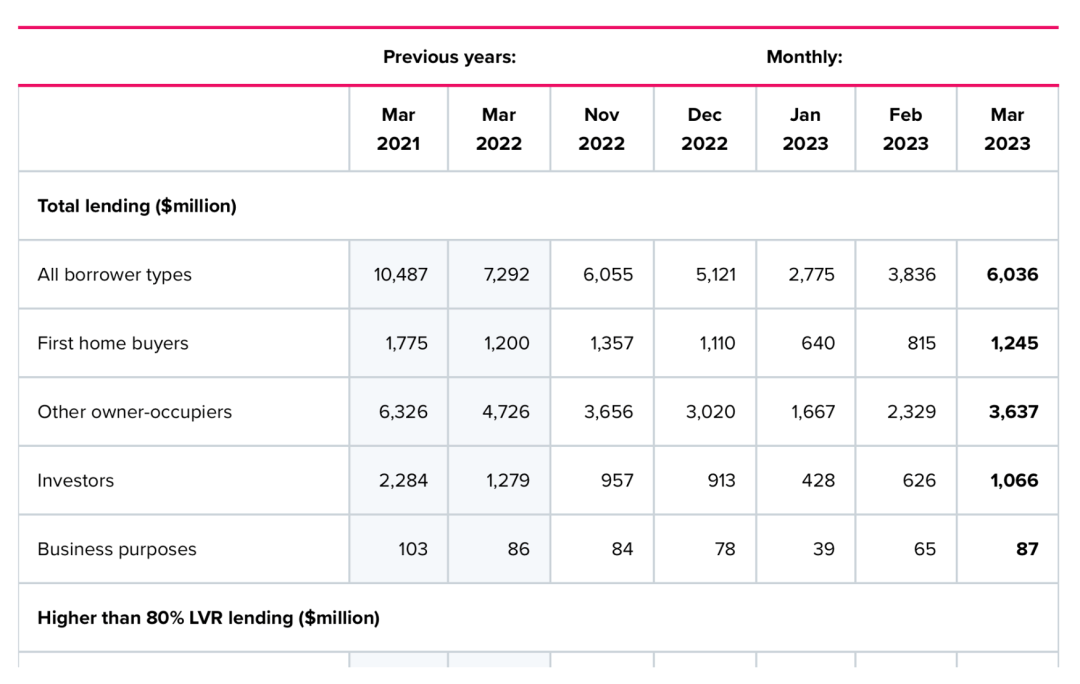
Mortgage approvals have jumped
Rising sales usually coincide with an increase in lending, but changes in the proportion of sales financed by loans reveal further details.
Calculations based on Reserve Bank of New Zealand reports show lending is now growing at close to, or even slightly above, the rate of growth in sales. This means current buyers are not solely cash buyers, as they were last year. The proportion buying with loans is gradually increasing, showing that despite high interest rates, many people can still afford or obtain a loan.
If only cash buyer numbers were increasing, the market could remain around the bottom for an extended period. However, simultaneous increases in the share of purchases financed by loans and in sales volumes may mean the market is building momentum for a rebound.

Image source: internet
Three main reasons behind the data
There are 3 main reasons for these figures. First, interest rate rises have reached the end of this hiking cycle and lending policies are beginning to change. Second, new purchasing power has emerged, mainly because of a large increase in migrant arrivals. Third, housing completions are slowing, changing the balance between supply and demand.
{ad}
The interest rate hiking cycle is ending
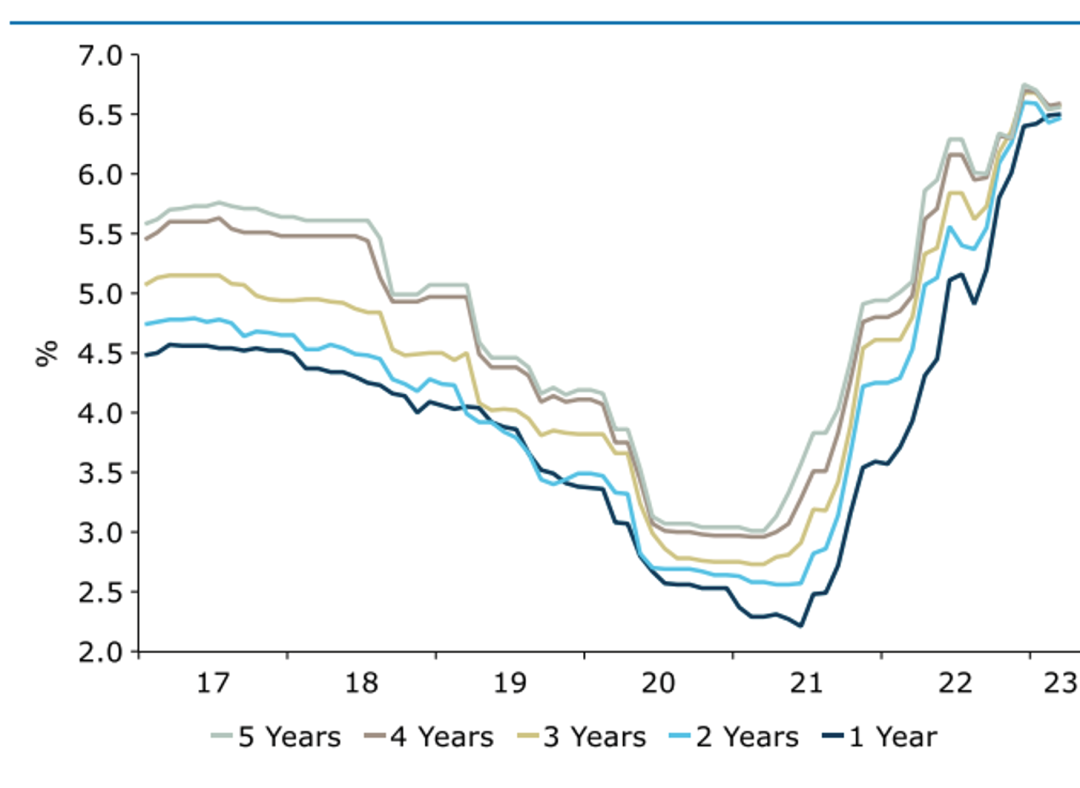
At the end of April, the Reserve Bank of New Zealand adjusted its LVR restrictions, effectively easing mortgage deposit requirements and signalling a more supportive stance. Internationally, the US Federal Reserve has begun indicating it may stop raising rates in June. Under the Reserve Bank of New Zealand’s original plan, May could bring the final increase of this hiking cycle. Interest rate markets have already responded.
The chart below shows fixed mortgage rate curves for different terms. Rates for longer terms of 4–5 years and shorter terms of 1–2 years converged after the start of 2023 and began falling. Some banks are even offering lower rates for longer fixed terms than for terms of 1 or 2 years. This means banks already expect interest rates to have peaked and borrowing costs to rise no further。
Migrant arrivals increase demand
The market broadly expected net migration of 30,000 to 40,000 people this year. However, net migration has continued to surge over the past 3 months. If this pace continues, this year’s total will exceed 100,000.
This means more purchasing power has entered the market than expected, and although it is too early to tell whether this will continue, the surge in migrant arrivals will, over time, cause shortages of resources and services, including housing.
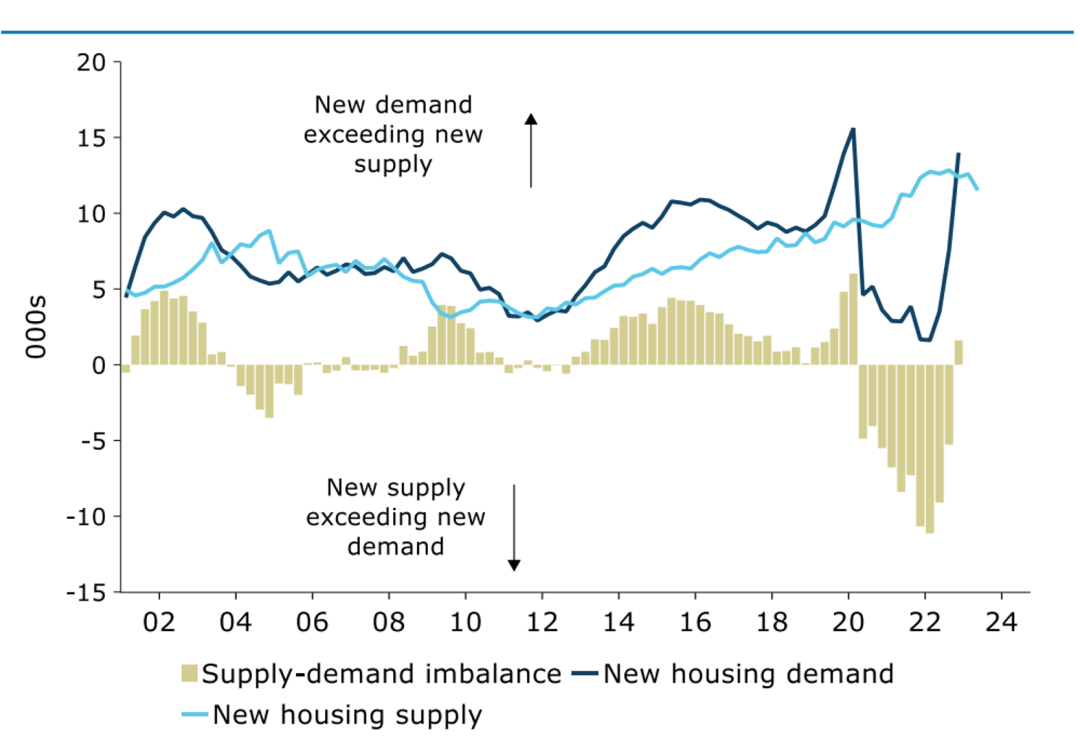
Housing supply falls rapidly as the balance of supply and demand reverses
The supply and demand curves below show new housing supply was broadly stable but began falling after 2022, as shown by the blue curve. Demand, shown by the black curve, fluctuated sharply because of the pandemic. The net balance of supply minus demand, shown by the yellow bars, indicates that supply exceeded demand from 2020 to 2023, whereas supply had failed to keep pace with demand for the preceding 8 years.
Housing supply had failed to keep up with demand for 8 years before 2020. Following sharp interest rate cuts in 2020, this accumulated demand erupted in 2020, driving house prices up by nearly 40% over 2020–2021.
When interest rates rose in 2022, the excess supply from 2020–2021 combined with high rates to push house prices down by nearly 20% from 2022 to the present.
As the downturn continues, supply has now fallen while migrant arrivals are increasing demand. The net balance of supply and demand will reverse in 2023, leaving the market undersupplied.
Prices reflect supply and demand, and will rise when supply is insufficient. However, housing is a major asset and the market has considerable inertia, while purchasing power is closely linked to interest rates. The effects of changes in the current supply and demand curves will take time to emerge, but some perceptive people can see the trend and act accordingly.
The trigger
The market has now begun changing quietly and is waiting for a trigger. That trigger could be a reversal in monetary policy, such as the first talk of an interest rate cut, or the election to be held in October 2023.
Both would have similar effects on the market. An election delays transactions, allowing buying pressure to build further. New property or monetary policies following a change of government would ignite purchasing power.
To avoid the market’s pre-election lull, some perceptive buyers and those with an immediate need for a home have stopped chasing lower prices. This has produced the leading signals shown at the start of this article.
For owner-occupiers and buyers replacing their current home, the continued depletion of desirable properties means there is less and less time and opportunity to choose freely. Auckland is the first port of call for migrants, and many will choose to live there. Accumulated purchasing power will far exceed that of other regions.