
Is the housing market holding firm or starting to decline? What the figures can tell us
Since the pandemic spread in March, the property market has been seen as an important indicator of New Zealand’s economic direction. Puzzlingly, property experts and economists hold almost diametrically opposed views of its short-term prospects. One side believes the market is stable, with minor fluctuations unlikely to disturb the overall upward trend; the other insists a noticeable, or even severe, downturn is inevitable.

Which view will the Real Estate Institute of New Zealand’s (REINZ) House Price Index (HPI) support?
House prices peaked in March
The Real Estate Institute of New Zealand’s (REINZ) House Price Index (HPI) suggests house prices may have peaked in March, before beginning a gradual decline.
The nationwide HPI reached a record high in March, then fell in April and May. It is now 2.4% below its March level.
{ad}
The chart below shows monthly HPI trends from May last year to May this year for three groups: New Zealand overall, Auckland, and New Zealand excluding Auckland.
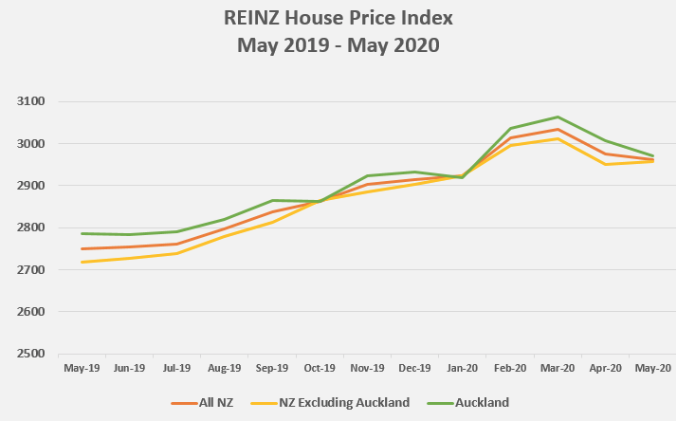
All three sets of figures clearly show a very similar trend: From last year’s month 8 to this year’s month 1, prices rose steadily, then surged in month 2 and peaked in month 3 before beginning to fall.
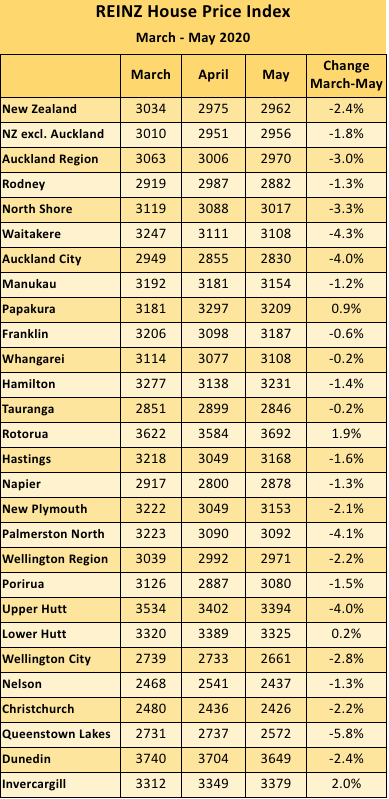
The table shows changes in the HPI for 28 cities and districts nationwide, from the March peak to the end of May, along with the percentage change over that period.
Of the 28 areas recorded, only four posted gains between March and May: Papakura in southern Auckland, up 0.9%; Rotorua, up 1.9%; Lower Hutt, up 0.2%; and Invercargill, up 2.0%.
The remaining 24 areas all recorded declines. The largest falls were in Queenstown Lakes, down 5.8%; Waitakere in west Auckland, down 4.3%; Palmerston North, down 4.1%; Auckland City — the city and surrounding areas within the former Auckland City Council boundary — down 4.0%; and Upper Hutt, down 4.0%.
A quick guide: what is the HPI?
HPI stands for Housing Price Index. It is a relative measure showing the overall direction and scale of property price changes, used by the industry worldwide for quantitative analysis of property price trends.
New Zealand’s HPI was jointly developed by REINZ and the Reserve Bank of New Zealand. It is considered a more accurate measure of house price trends than average sale prices because it adjusts for differences in the types of homes sold each month.
Lockdown’s substantial impact
Although these figures show a trend towards more reasonable levels, it should, for now at least, be regarded as temporary.
After all, lockdown restrictions severely affected the property market in April and May, leaving sales volumes well below historical norms.
Even after the Level 4 lockdown ended, only two viewings per property per day were permitted at Level 3. This left prospective buyers without sufficient time to make effective decisions.
As REINZ chief executive Bindi Norwell noted: “The number of residential properties sold in New Zealand in May this year fell 46.6% compared with the same month last year. But this is unsurprising given that the first 12 days of May were spent under Level 3 lockdown.”
Norwell was unimpressed by the Government’s initial intention to continue restricting viewings at Level 3. Norwell said the Government’s eventual concession, allowing property sales to proceed at Level 3, benefited buyers and sellers and helped the market return to normal more quickly.
REINZ’s property sales figures for May show:
New Zealand property sales fell 46.6% year on year, from 7,477 to 3,990.
Outside Auckland, house sales fell 47.4% year on year, from 5,464 to 2,873.
In Auckland, house sales in May fell 44.5% year on year, from 2,013 to 1,117.
The regions with the largest year-on-year falls in sales in May were:
Tasman: down 62.5% (house sales fell from 80 to 30 — 50 fewer homes)
- Otago: down 56.2% (from 479 to 210 — 269 fewer homes)
- Southland: down 54.8% (from 210 to 95 — 115 fewer homes)
- Marlborough: down 54.3% (from 105 to 48 — 57 fewer homes).
May: has recovery begun?
However, the figures also show strong growth in sales activity compared with April. Sales volumes almost tripled from their Level 4 lockdown level, rising from 1,371 to 3,990, an increase of 191.0%.
Bindi Norwell sees this as a positive sign.
“As we moved from April into May, sales began increasing, with 15 of the country’s 16 regions recording a threefold increase in sales activity from the previous month.” The sole exception was Auckland, although it still recorded a 98.8% increase compared with April.
Bindi Norwel believes: “New listings remain scarce, which will continue to affect sales volumes. Hopefully, as the pandemic alert drops to its lowest level, confidence will gradually build and the shortage of listings will ease.
” It seems the bigger issue for the market at present is not falling prices, but a shortage of new listings leaving prices in place with little trading.
Will the wider economy affect prices?
However, in a housing confidence report, Westpac chief economist Dominick Stephens supported views previously expressed by some economists, arguing that the HPI figures simply reinforced expectations of falling house prices. He explained: “New Zealand is in the shadow of a severe recession, and house prices usually fall during recessions.”
Dominick Stephens said: “We expect house price falls to be no worse than during the global financial crisis, but more severe than during the recessions of the early 1990s or late 1990s.” If that conclusion offers any comfort.
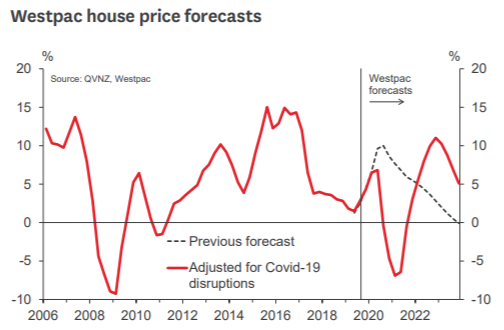
Once again, the two sides hold firm to their views. It appears another month or two may be needed to establish whether the past two months’ house price falls are temporary or part of a longer-term trend.