
The August housing market: beyond prices, which record-breaking figures will shape its future?
When New Zealand first went into nationwide lockdown because of COVID-19, the economy entered a downturn and economists predicted that property would be the first market to crash. By last week, Westpac's latest economic bulletin was predicting that house prices would rise by a further 8% next year. This market seems unaffected by theory or reality, global or domestic conditions, politics or people's livelihoods. It simply keeps surging ahead, breaking historical records along the way.
The latest figures from the Real Estate Institute of New Zealand (REINZ) show that New Zealand's residential market again broke several longstanding records in August. REINZ chief executive Bindi Norwell said: 'Over the past few weeks, sales reports from across the country have shown strong housing market activity and persistently high prices.'
Median house prices reach new highs
- According to New Zealand's most comprehensive and accurate property data, the national median house price reached NZ$675,000 in August, up 4% year on year from NZ$580,000 in August 2019, and up 2.4% from NZ$659,000 in July this year. Every region recorded year-on-year growth in its median house price. Auckland's median house price reached a record NZ$950,000, up 16.0% from NZ$819,000 a year earlier and 3.5% from NZ$918,097 in July this year.
- The national median house price excluding Auckland was NZ$570,000, up 2% from NZ$499,000 a year earlier and above the NZ$557,500 recorded in July this year, also setting a new NZ dollar record, NZ dollars, NZ dollars. NZ dollars, NZ dollars, NZ dollars.
Alongside Auckland, 7 main regions and 17 districts/cities recorded all-time median house price highs in August:
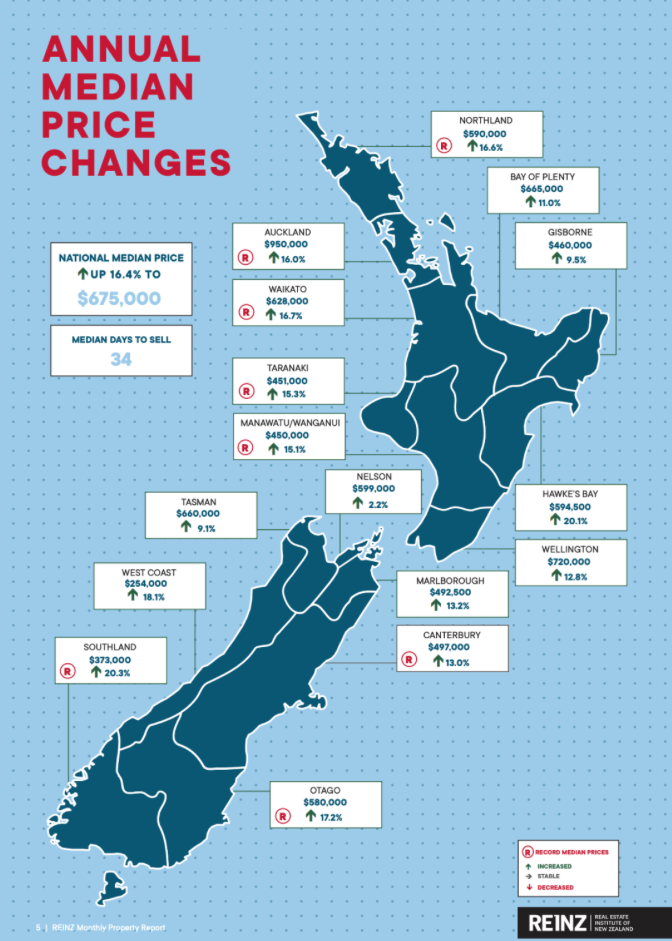
– Northland's house price rose from NZ$506,000 a year earlier to NZ$590,000, an increase of 16.6%. Within the region, Whangarei's median price reached a record NZ$610,000;
– Waikato's price rose from NZ$538,000 a year earlier to NZ$628,000, an increase of 16.7%, setting a new regional median price record for the fourth consecutive month. Another 3 districts within the region also recorded median house price highs: Matamata-Piako (NZ$587,000), Otorohanga (NZ$418,500) and Waipa (715,000 district);
– Manawatu/Wanganui's price rose from NZ$391,000 a year earlier to NZ$450,000, an increase of 15.1%. Within the region, 3 districts also recorded median house price highs: Tararua (NZ$320,000), Manawatu (NZ$535,000) and Whanganui (NZ$375,000);
– Taranaki's house price rose from NZ$391,000 a year earlier to NZ$451,000, an increase of 15.3%;
– Canterbury's house price rose 14.9% from NZ$440,000 a year earlier to NZ$497,000. Within the region, Ashburton (NZ$391,500) and Waimakariri (NZ$515,000) also recorded new median price highs;
– Otago's house price rose from NZ$495,000 a year earlier to NZ$580,000, an increase of 17.2%; – Southland's price rose 20.3% from NZ$310,000 a year earlier to NZ$373,000.
Other districts/cities also recorded all-time median price highs, including Rotorua (NZ$510,000), Tauranga (NZ$745,000), Lower Hutt (NZ$670,000), Upper Hutt (NZ$663,200), Papakura (NZ$775,000), Rodney (NZ$961,000) and Waitakere ($890,000).
Norwell identified the following factors:
– Low interest rates
– The removal of LVR restrictions
– A shortage of listings
– People's desire for more living space
– The market's recovery after lockdown
– Large numbers of first-home buyers entering the market,
which together have driven price increases in recent months. 'Unless more properties come onto the market before Christmas, house prices and affordability will come under further pressure,' she said.
{ad}
Strongest August sales in 5 years
The total number of residential properties sold nationwide in August rose 24.8% from 6,132 a year earlier to 7,652, making it the busiest August for sales in 5 years.
- In Auckland, the number of homes sold in August rose 2% year on year, from 1,812 to 2,612, the highest August total in 5 years.
- Across the rest of the country, the number of homes sold rose 7% year on year, from 4,320 to 5,040, the highest August total in 4 years.
Norwell said: 'Sales volumes show that August was a very busy month across many parts of the country. Auckland, Nelson (up 40.0%), Southland (up 38.6%) and Hawke's Bay (up 32.5%) recorded particularly strong increases. Nationwide, 1,520 more residential properties sold in August this year than a year earlier, equivalent to an extra 49 properties a day. That is simply incredible.'
She also noted that Auckland's Level 3 lockdown, which began on 12 August, had little impact on sales volumes. 'This shows that widespread adoption of digital technology has become key to keeping the property market operating as alert levels rise.'
However, in contrast to the widespread rise in median prices, year-on-year sales volumes fell in Gisborne, Marlborough, the West Coast and Otago. Gisborne in particular recorded a 31.5% year-on-year decline, reaching its lowest August level since 2011. 'Sales volumes have also declined year on year in recent months, indicating that a shortage of listings is beginning to emerge in the region,' Norwell concluded.
House Price Index (HPI) reaches a new high
REINZ's New Zealand House Price Index (HPI), which measures price changes in the property market, rose 10.0% year on year to a new high of 3,072.
- Auckland's HPI rose 7% year on year to a record 3,121.
- The national HPI excluding Auckland rose 5% year on year to 3,033, also a record high.
In August, Gisborne/Hawke's Bay recorded the highest annual growth rate at 14.7%, reaching a new record of 3,331. Taranaki followed with annual growth of 14.3%, reaching 3,358. Wellington ranked third, with annual growth of 11.6% to a record 3065, its first appearance among the top three for growth in 25 months.
Data for the past 3 months show that, despite the effects of COVID-19, New Zealand's HPI still rose 4.6%, the strongest rate of growth in 49 months.
Inventory at its lowest level on record
Alongside steadily rising sale prices, the number of homes available has continued to shrink. The total number of homes for sale nationwide fell from 20,712 a year earlier to 17,974, a reduction of 2738, or a change of -13.2%, taking inventory to its lowest level on record.
In August, only two regions recorded year-on-year increases in housing inventory: Hawke's Bay (+3.0%), from 396 to 408 properties; and Southland (+3.4%), from 324 to 335 properties.
The largest percentage declines in total inventory were in:
- Taranaki: -48.0%, from 546 to 284 properties;
- Marlborough: -36.2%, from 254 to 162 properties;
- Northland: -30.3%, from 1,318 to 919 properties – a reduction of 399.
Wellington had the lowest inventory measured in weeks, with just 6 weeks of stock available to buyers, down 1 week from a year earlier. Hawke's Bay and Manawatu/Wanganui followed, both with just 8 weeks of inventory.
Fastest August selling times in 4 years
In August, the national median time to sell fell from 39 days a year earlier to 34 days, a reduction of 5 days. This was the shortest selling time for August in 4 years, matching the figure for July this year.
- Auckland's median time to sell fell from 44 days to 35 days, a reduction of 9 days and the fastest August selling time in 4 years.
- The national median time to sell excluding Auckland fell from 37 days to 33 days, a reduction of 4 days. This was also the fastest in 4 years, matching July this year.
Taranaki recorded the fastest selling time at just 24 days, 11 days shorter than a year earlier and 1 day shorter than July this year. This was the region's shortest August selling time on record.
Manawatu/Wanganui recorded the second-shortest median selling time in August, at 27 days, matching August last year and down 1 day from July this year. This was its shortest August selling time since 2005.
The West Coast had the country's longest selling time at 78 days, although this was still 16 days shorter than a year earlier.
Commenting on the short selling times, Norwell said: 'All but two regions had average selling times below 40 days in August. This is unusual for this time of year, but continuing demand for property is driving the trend. We still hope people will take some time to carry out proper due diligence before committing their money to a home purchase.'
Highest auction share in 4 years
In August, auctions accounted for 16.1% of total property sales nationwide, with 1,232 properties sold by auction. This was well above the 10.6% recorded a year earlier, when 650 properties sold by auction. It was the highest August auction share in 4 years.
Gisborne had the highest auction share at 51.4% (19 properties), up from 31.5% (17 properties) in August 2019.
Auckland had the country's second-highest auction share, rising from 18.3% (332 properties) a year earlier to 31.0% (811 properties), its highest share in 5 months.
Bay of Plenty ranked third, with its auction share rising from 13.2% (63 properties) in August 2019 to 17.5% (90 properties). This was the region's highest August auction share in 3 years.
High-priced homes reach a new share of sales
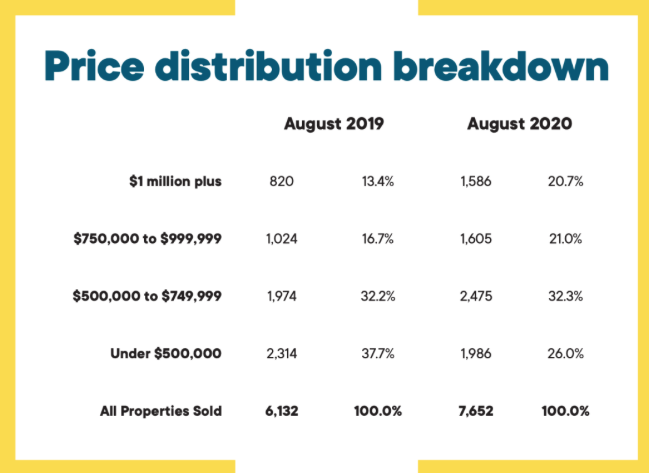
Nationwide, the share of homes selling for less than NZ$500,000 fell from 37.7% (2,314 properties) in August 2019 to 26.0% (1,986 properties) in August 2020.
The share of homes selling for between NZ$500,000 and NZ$750,000 rose from 32.2% (1,974 properties) in August 2019 to 32.3% (2,475 properties) in August 2020.
At the upper end of the residential market, the share of homes selling for NZ$1,000,000 or more rose from 13.4% (820 properties) in August 2019 to 20.7% (1,586 properties) in August 2020, the highest August level on record.
'As we move into spring, it will be very interesting to see where the market goes next, as property sales traditionally rise as the weather warms. Yet, as we have already seen, the market in 2020 seems to have defied every prediction and broken every convention. However, the full impact of COVID-19 may still lie ahead, particularly in terms of unemployment and the economy,' Norwell concluded.